EURJPY Technical Analysis May 17/2019
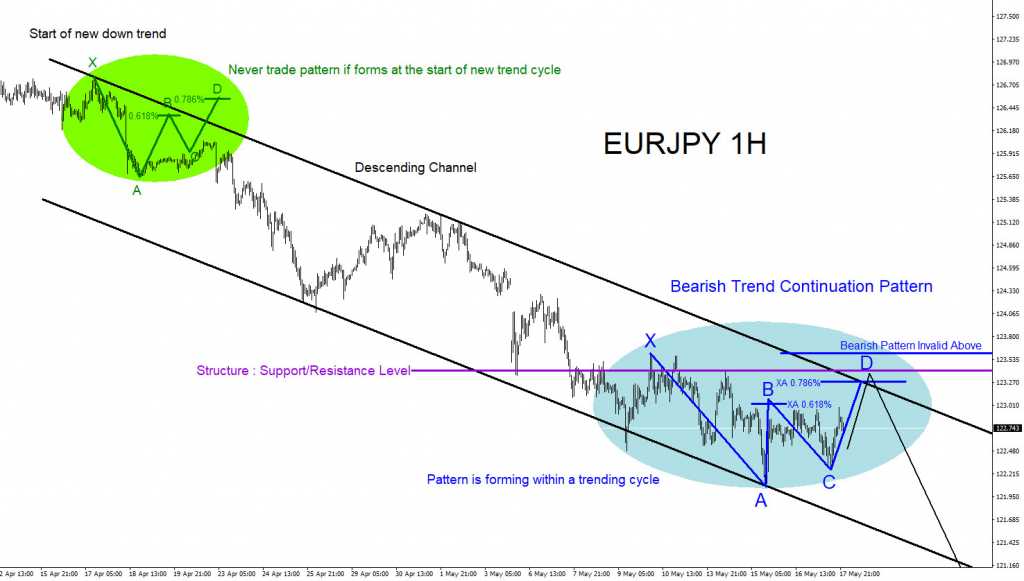
EURJPY can be possibly forming a bearish Gartley pattern. A Gartley pattern is a continuation of trend market pattern. This market pattern must form within a trending cycle and should never be traded if it forms at the beginning of a new trend cycle. The Gartley market pattern needs 5 points to form. Points X, A, B, C and D. The X-A leg is the initial move higher or lower. The A-B leg terminates at the 0.618% Fib. retracement of the X-A leg. The B-C leg terminates inside the 0.382% to 0.886% Fib. retracement of the A-B leg. The C-D leg terminates at the 0.786% Fib. retracement of the X-A leg. The point D 0.786% Fib. retracement level is where the trade entry is triggered. In the EURJPY 1 hour chart below, there is a possible bearish Gartley pattern forming (blue). Price has yet to hit the blue XA 0.786% Fib. retracement level so traders will need to wait to see if the pair makes another push higher in the coming trading sessions. If looking to SELL EURJPY traders should be patient and wait for price to make a minimum move higher to the blue XA 0.786% Fib. retracement level. Waiting for price to move to the minimum XA 0.786% Fib. retracement SELL level will offer a better risk/reward trade setup. Stops should be placed above the point X of the blue bearish pattern. Above the point X invalidates the bearish pattern. As long as price stays below point X watch for EURJPY to make newer lows below point A where targets will be waiting to get hit. If price moves below the blue point C before hitting the 0.786% level then the pattern is invalidated and trade setup should be cancelled. Only time will tell what EURJPY will do but at least now you are aware of the level where the pair can possibly sell off from.
EURJPY 1 Hour Chart 5.17.2019

Of course, like any strategy/technique, there will be times when the strategy/technique fails so proper money/risk management should always be used on every trade. Hope you enjoyed this article.

