In this blog, we revisit Turkish Lira Elliott wave analysis presented back in August 2018 and present the latest USDTRY Elliott Wave Analysis. We were looking for a bounce to fail below August 2018 peak for another leg lower to complete a larger 3 waves correction down from August 2018 peak before buyers entered the market again.
Let’s take a look at USDTRY Daily chart below to see how price action unfolded since August 2018
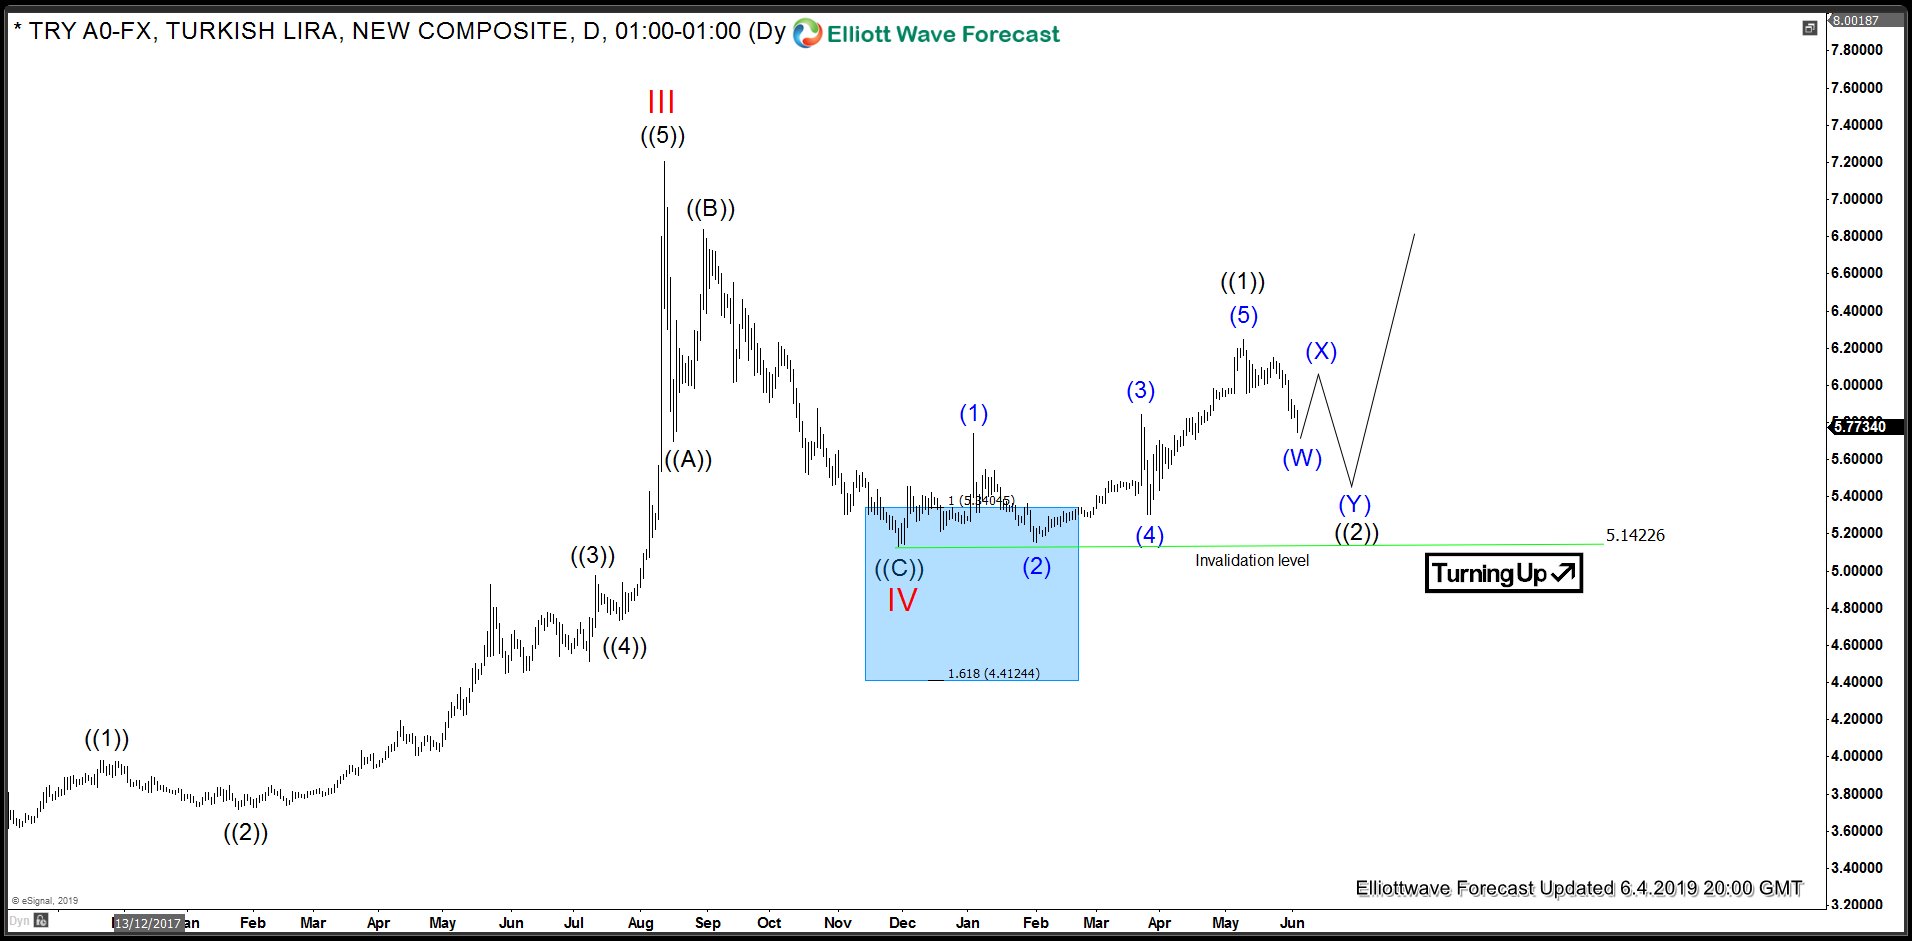
USDTRY Elliott Wave Analysis – Daily Time Frame
We can see the bounce failed below August 2018 peak as expected and price turned lower again. It reached blue box which was 100 – 123.6 extension area of black ((A)) – ((B)) where buyers appeared as expected and produced a bounce. The bounce appears to be in 5 swings as we will show in the 4 Hour chart below.
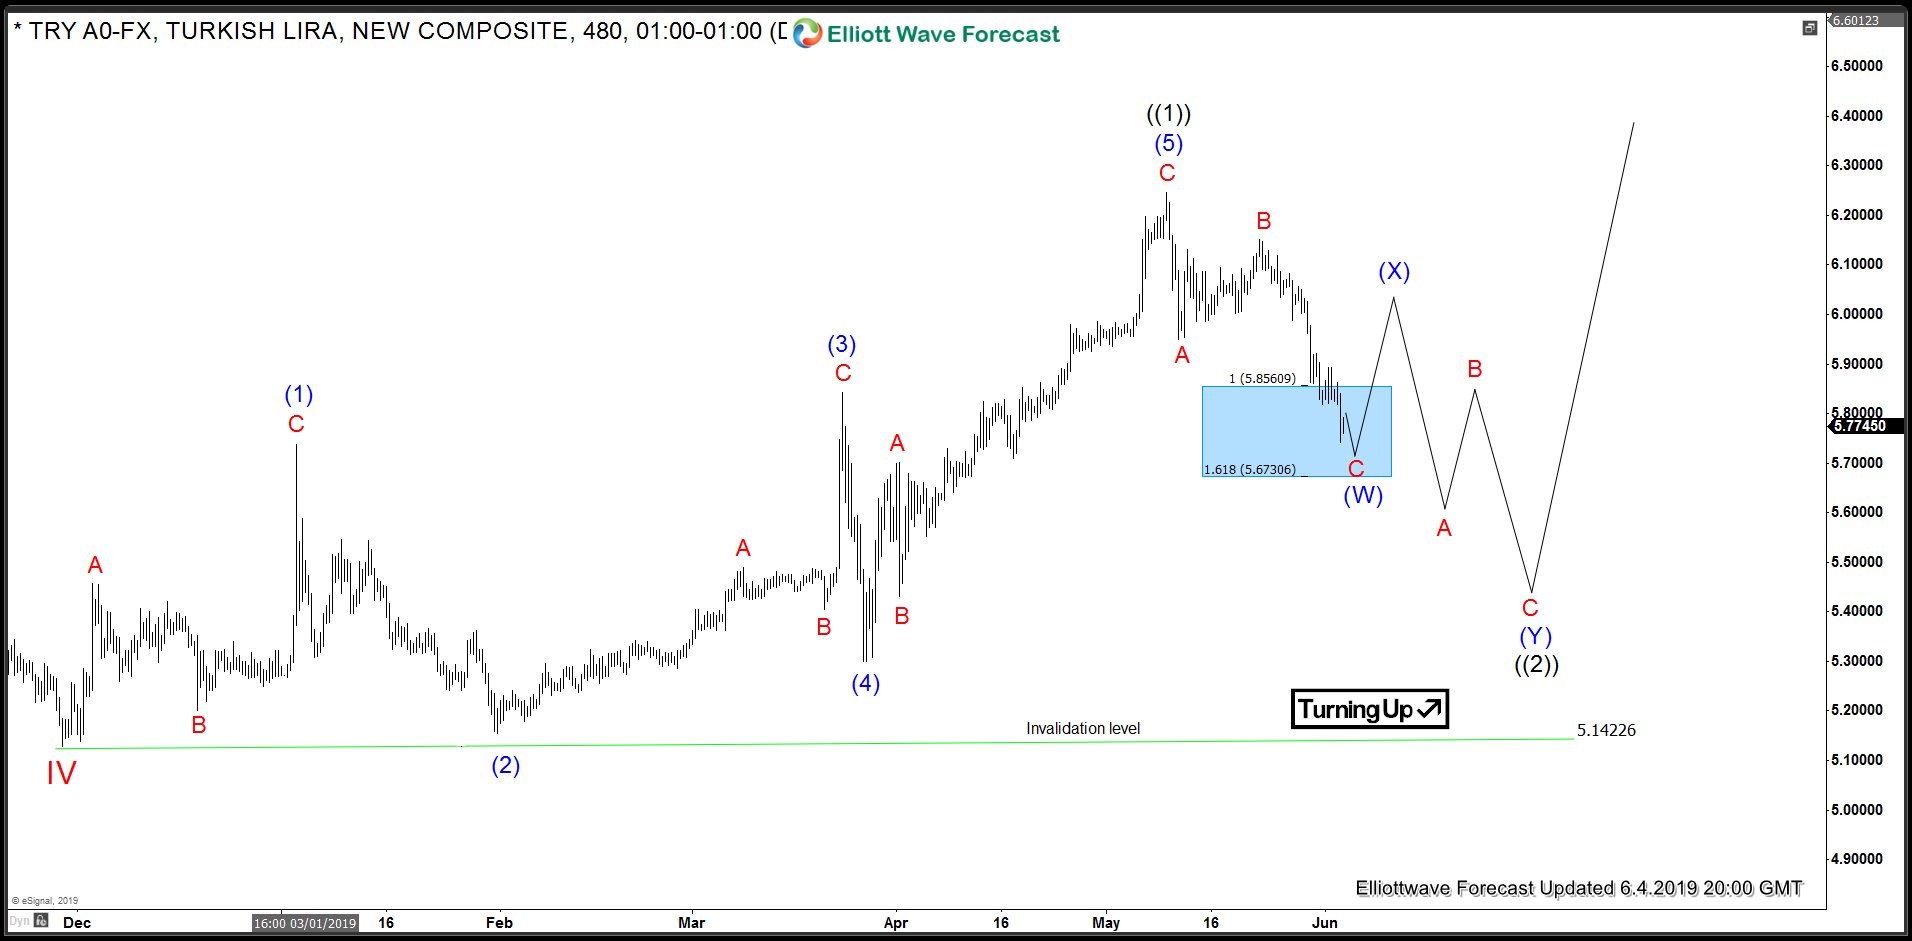
USDTRY Elliott Wave Analysis – 480 Minute Time Frame
Preferred view suggests that cycle from 11/29/2018 low (5.129) ended at 5/9/2019 (6.199). This move can be counted in 11 swings and hence appears to be a diagonal structure. We have labelled this as wave (( 1)) and now expected a wave (( 2 )) pull back in 3, 7 or 11 swings. Pair is already showing 3 waves down from the peak and as far as it stay above 5.67306 level, expect a 3 waves bounce in wave (X) to correct the decline from 5/9/2019 peak before another 3 swings lower are seen to complete wave (( 2)) pull back as a double three Elliott Wave structure. A break below 5.67306 would suggest decline from 5/9/2019 peak could take the form of an impulse in the first leg when pair would still need a 4,5 to complete the 1st leg as an impulse i.e. wave (A) before we get a bounce in wave (B) and lower again to complete wave (( 2 )) pull back as Zigzag Elliott Wave Structure. We don’t like selling and consider the buying after 7 swings lower in wave (( 2)) to be a safer strategy.
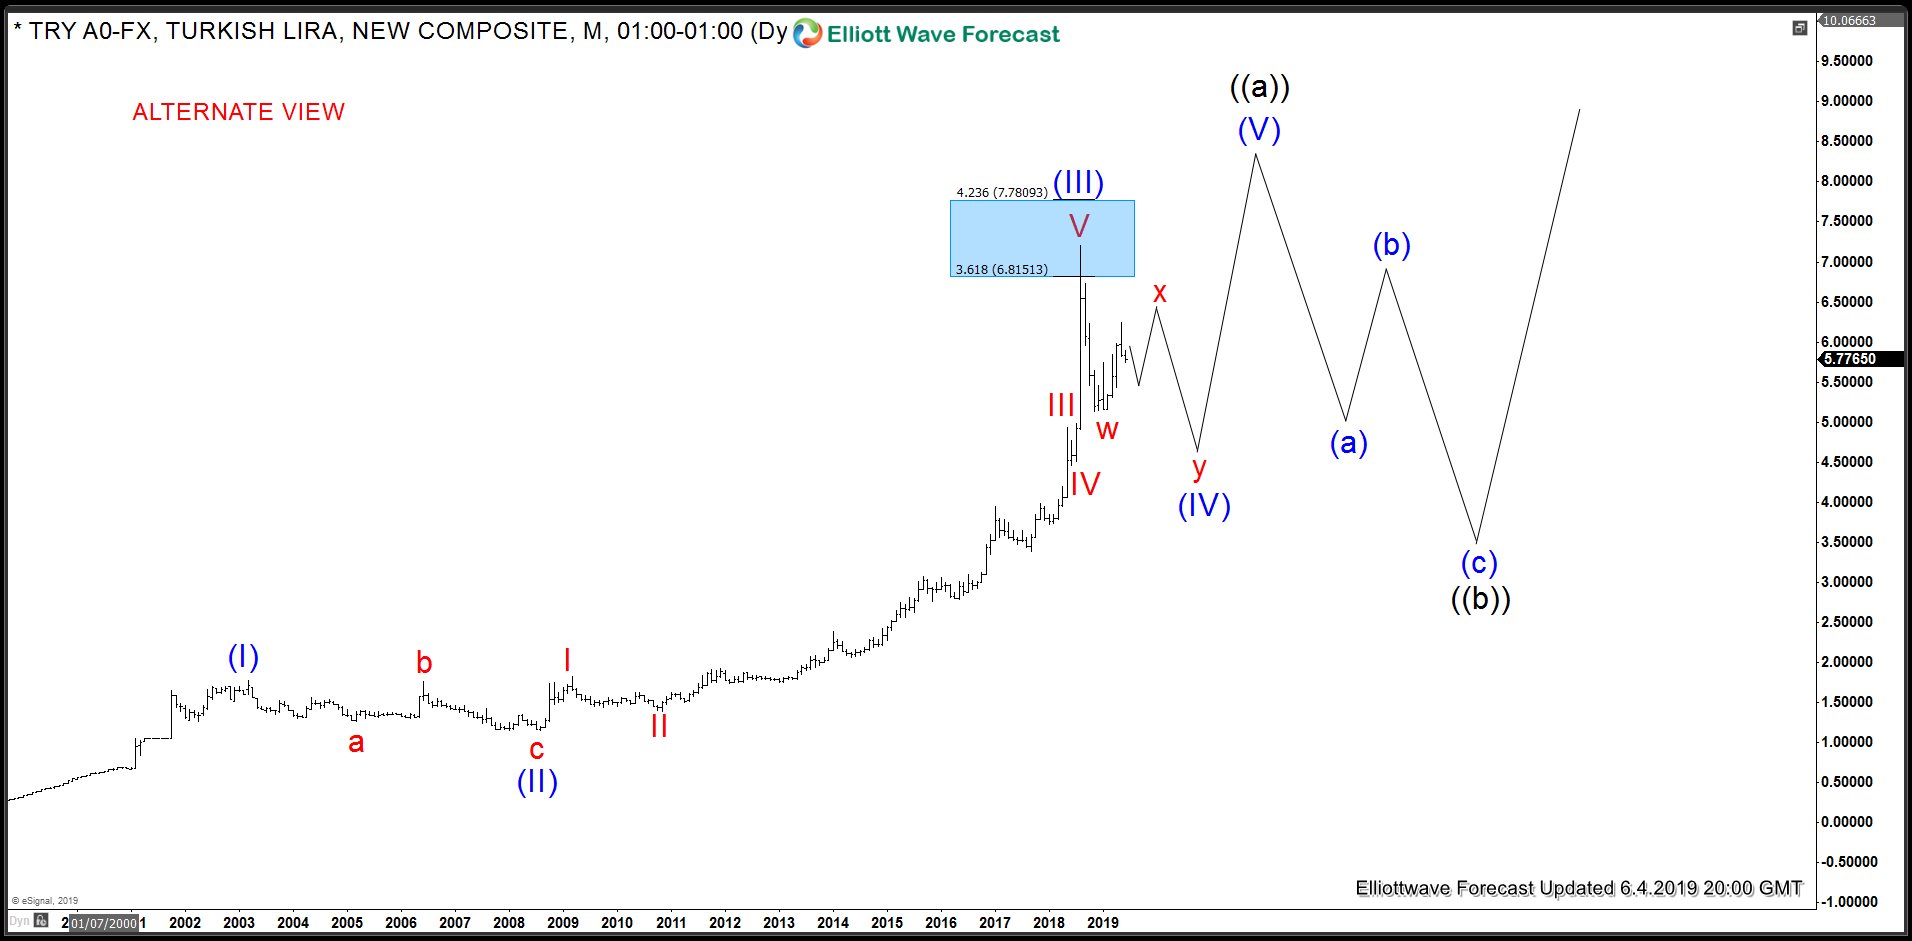
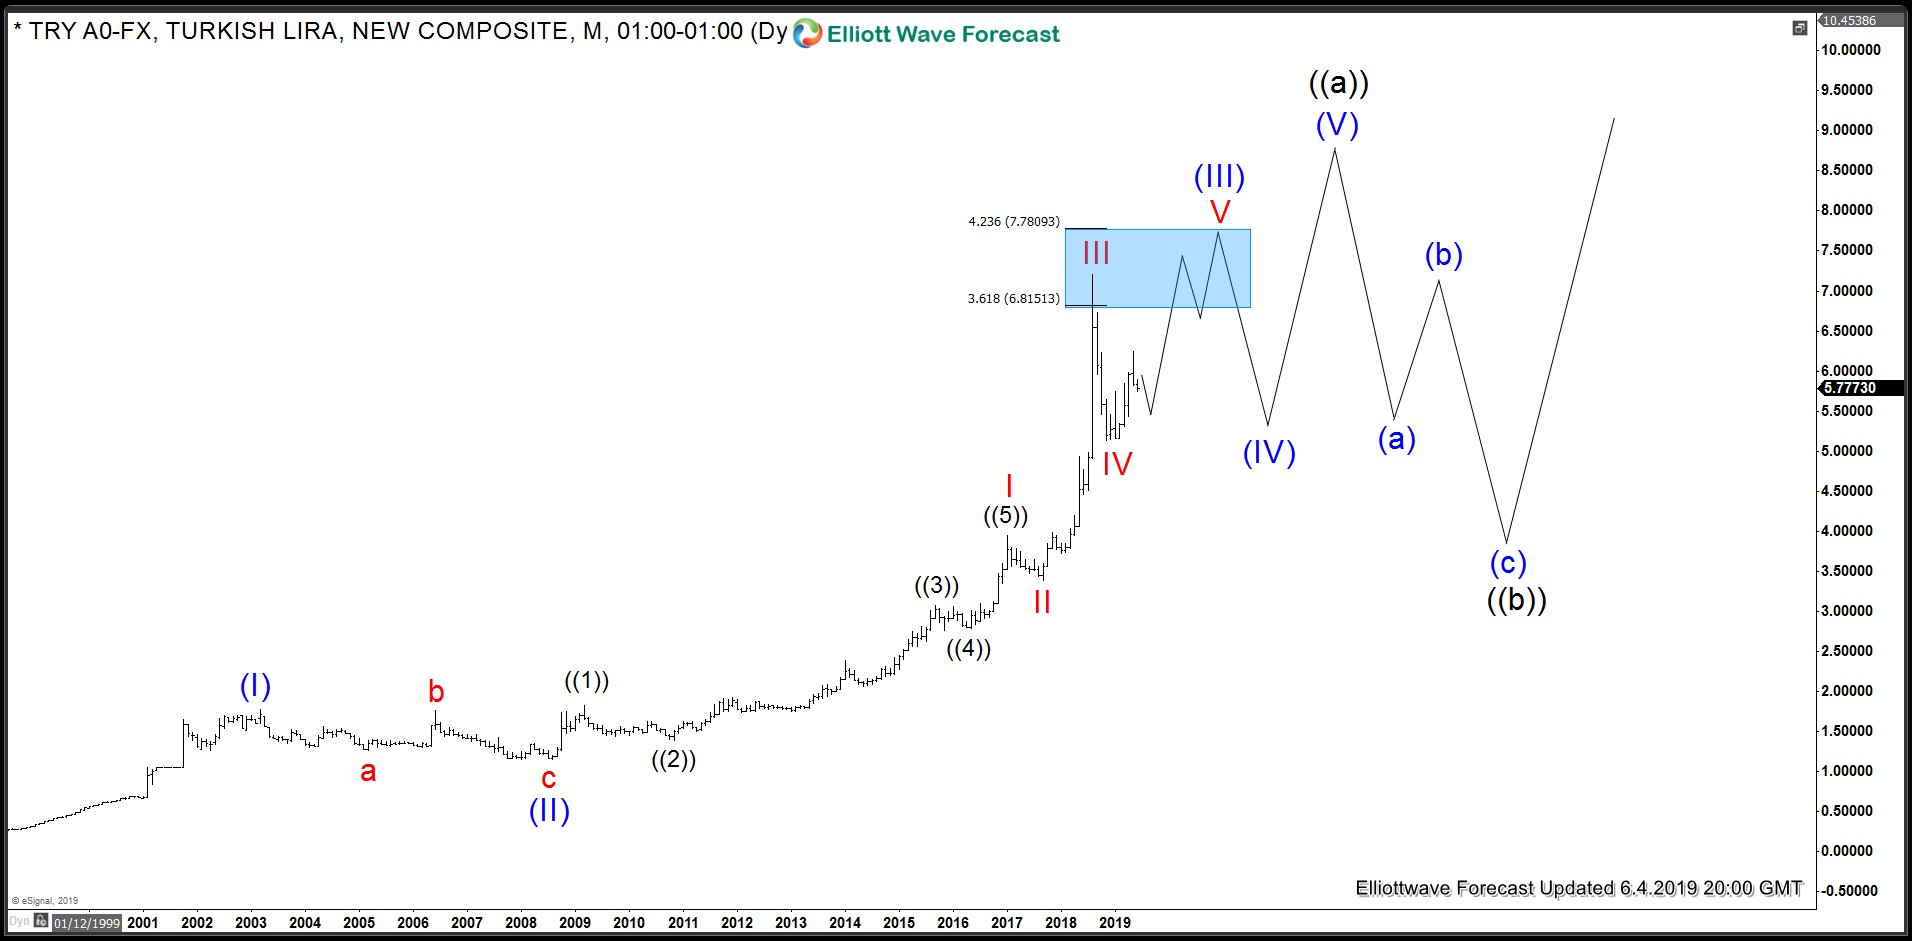
In the end, we will revisit the Weekly chart and present an alternate path in the weekly time frame.
USDTRY Weekly Elliott Wave Analysis
USDTRY Weekly Elliott Wave Analysis – Alternate view