Microsoft: More Upside within the Super Cycle Degree
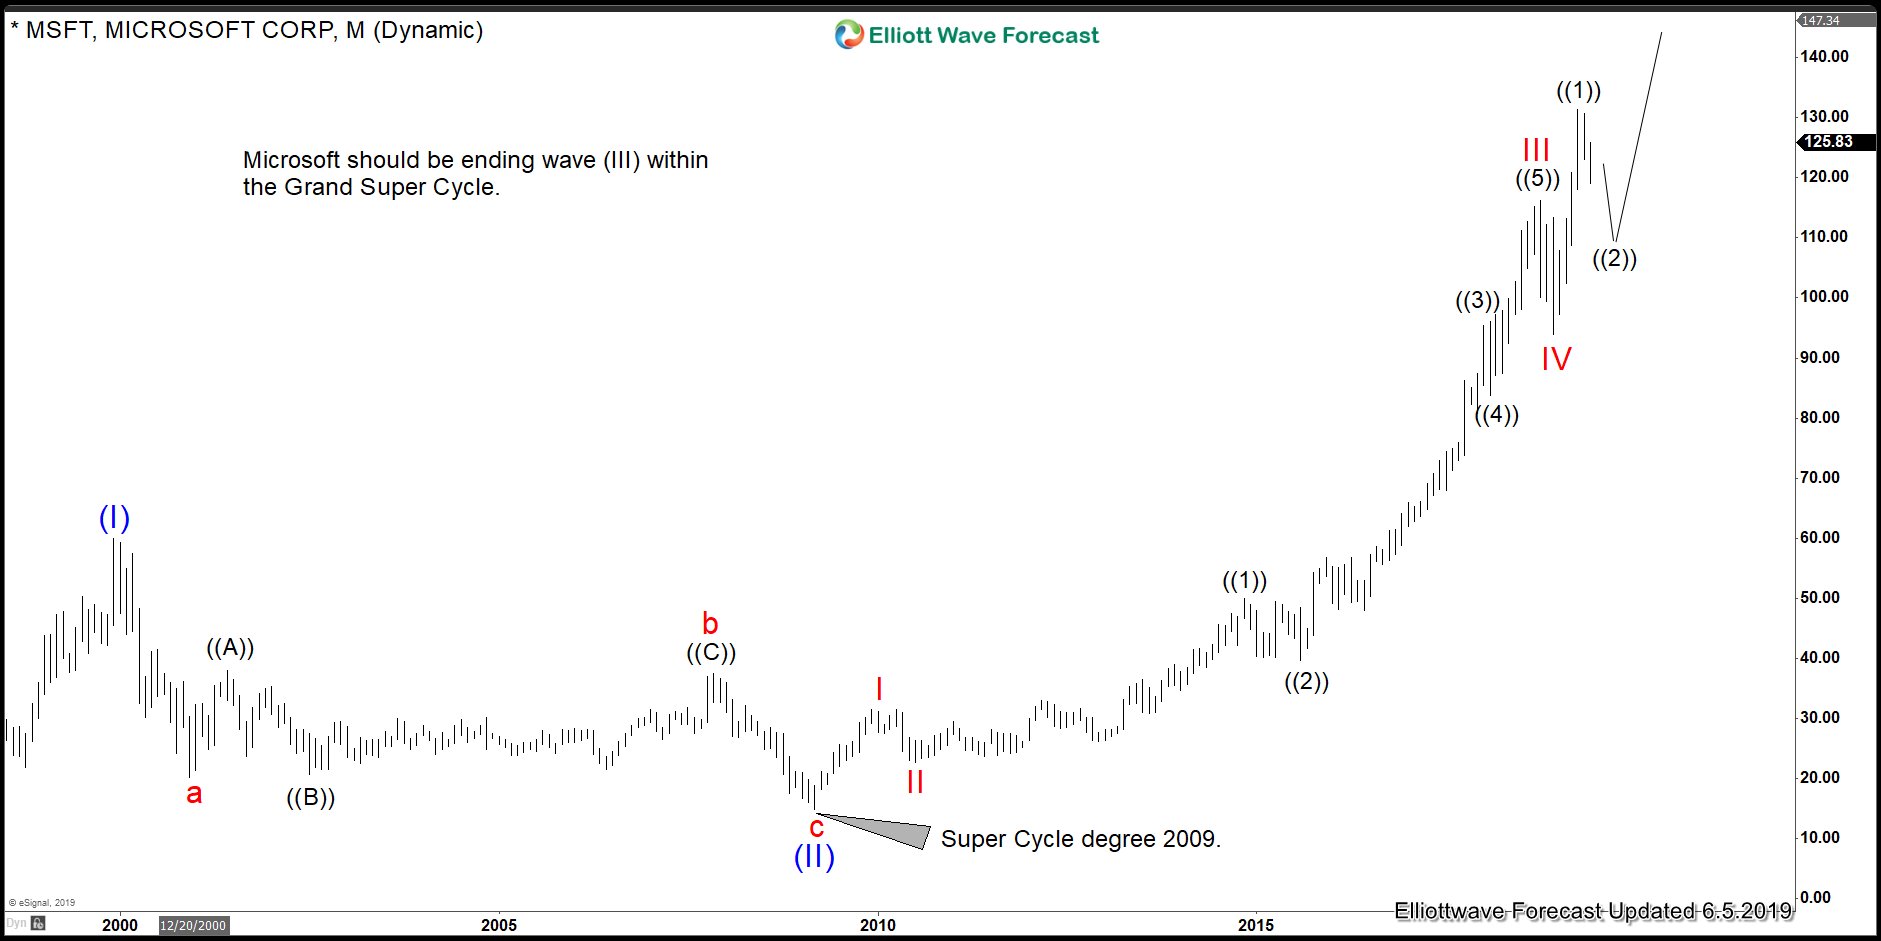
Microsoft (MSFT) has been in a tremendous rally since the lows at 2009. Without a question, the stock is developing into a nice 5 waves advance. The Elliott Wave Theory’s main pattern is an advance in 5 waves with the trend and a 3 waves pullback against the trend. In an impulse, as a guideline, wave (III) typically has an extension relative to wave (I). In this case, we have more than enough extension as the stock has passed the 1.618% fibonacci extension at 112.51 area. The following chart is showing the Monthly chart of $MSFT

As the chart above shows, MSFT has already shown 5 waves from the lows at 2009. This low is also the same low across the World Indices. We believe the stock will extend higher within wave V, as far as the lows on December 2018 remains in place. The move higher will also end Super Cycle degree wave (I) and start the biggest correction. The move is very technical and cycles are very well defined. A great opportunity into a multi month buy will come sometimes by the end of the Summer.
Similar to many World Indices, we are looking at important peak sometimes at the end of year 2020. However, like we mentioned before , as far as the last significant low on December 2018 holds, buying in 3-7-11 should be the right side. We want to highlight and acknowledge that the stock has already shown 5 waves since 2009, so technically it can also end and do bigger pullback. However, based on correlation with other stocks such as $BABA and $TESLA, we are calling extension within the wave V.

