Cisco Systems, Inc. (NASDAQ: CSCO) is an American multinational technology conglomerate that develops, manufactures and sells networking hardware, telecommunications equipment and other high-technology services and products. In the age of cloud-based services, Cisco has built its business by providing top-shelf internet connectivity hardware and services for years. providing Internet Protocol-based routers and switches that move data, voice, and video packets across networks.
In today’s article, we’ll take a look at the technical structure of the stock using the Elliott Wave Theory.
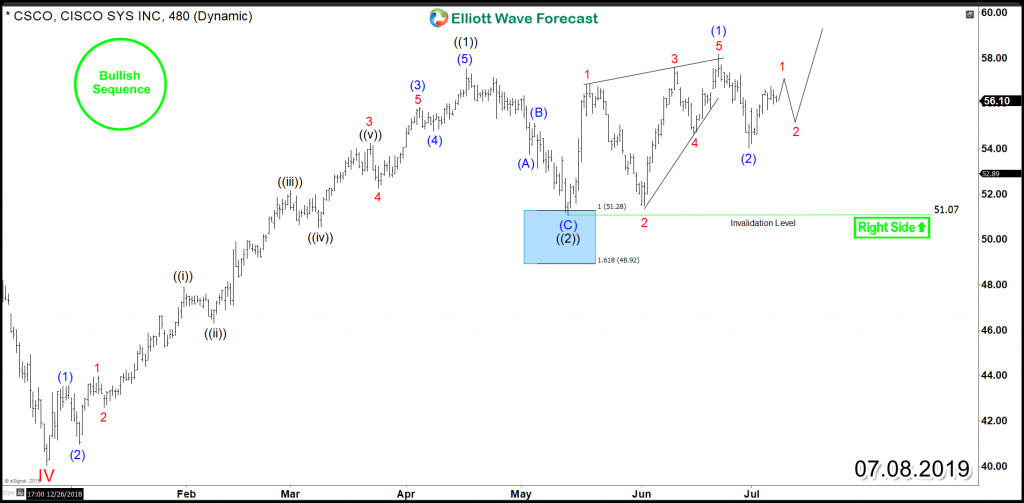
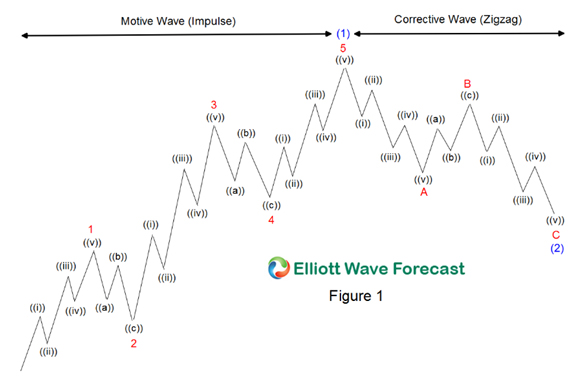
Since December 2018, CSCO rallied higher significantly (40%) breaking above 2018 peak. The advance higher is proposed to be an impulsive 5 waves move which was followed by 3 waves pullback Zigzag Structure into the blue box area $51.28. Up from there, the stock reacted higher again in 5 waves move taking the shape of a Leading Diagonal and it managed to trade above 2019 April peak.
The break higher crated a “Bullish Sequence” is suggesting that CSCO will continue the rally higher in a similar impulsive structure as long as it remain above $51 low and it will be aiming for a target to the upside toward $68 – $79 area before another correction can take place in a similar manner.
We have created the so-called sequences and Blue Boxes and a lot of other tools which we are using on a daily basis to locate the Right Side of the market. The blue boxes in our charts are the High-frequency areas where the Markets are likely to end cycles and make a turn therefore we use them in within our high accuracy system which acts as a great trading tool.
CSCO 8 Hour Chart 07.08.2019


