eBay (NASDAQ: EBAY) is the world’s largest online marketplace that facilitates consumer-to-consumer and business-to-consumer. The company was founded in 1995 and currently operating in about 30 countries.
The stock is up nearly 40% so far this year and the move higher was supported by a better-than-expected first-quarter results which saw improvement across several key operating metrics. The company is scheduled to report earnings after today’s market close Wednesday, July 17 and investors are looking for further confirmation about the recent enhancements.
We believe the market is ruled by technical aspect and the news is an after-fact event to drive the market into the pre-determined direction, therefore it’s important to understanding the Nature of the Market is key for traders which doesn’t have anything to do with Fundamentals or events.
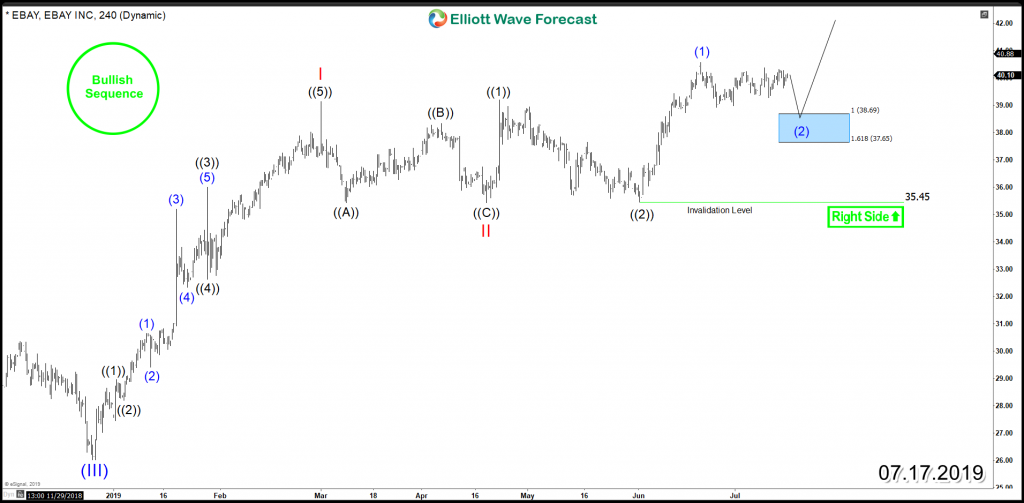
Based on Elliott Wave Theory , EBAY rally from December 2018 low unfolded as an impulsive 5 waves move which ended red wave I followed by a correction in 3 waves pullback in red wave II then the stock turned to the upside again creating a higher high bullish sequence which is aiming for a target higher at equal legs area $48 – $51.
eBay 4H Chart 7.17.2019

In the above 4H chart, we are looking for eBay to remain supported above $35.45 low and ideally it will find buyers in any 3 swings or 7 swings pullbacks taking place in the short term. The bullish sequence which started form December 2018 low is part of a larger degree cycle which can be observed on the next chart.
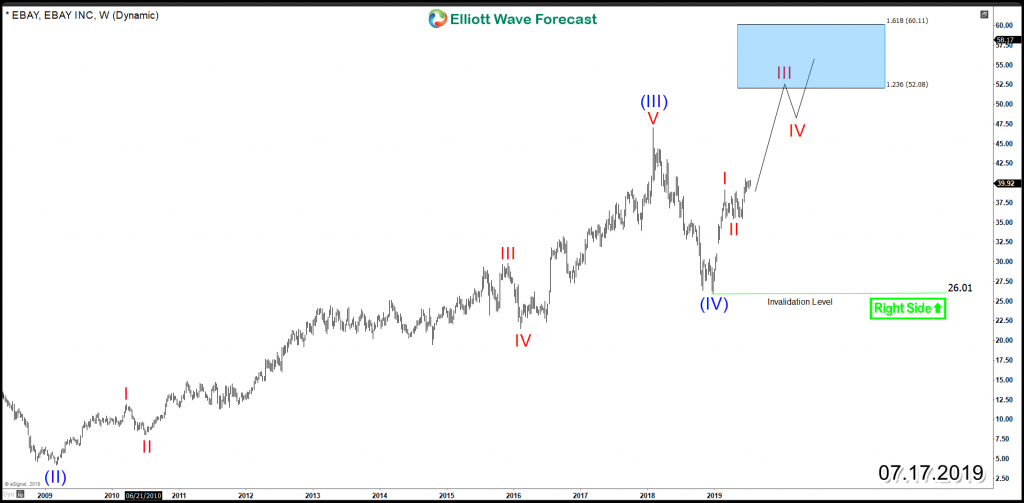
eBay Weekly Chart 7.17.2019

The sequence tags and Blue Boxes presented in our charts alongside other tools are used on a daily basis to locate the Right Side of the market which is in the case of ebay ” higher “. Consequently, as long as the stock trade above 26 then it will be aiming to continue the rally higher within the main weekly trend with a minimum target for a 5th wave at $52 – $60 area which means new all time highs will be expected to be seen in the coming weeks.

