General Motor’s contract with the United Auto Workers expired late Saturday, leaving the union and company leadership to work out the next four-year contract.
The situation has been all over the news which can be misleading for traders. We at Elliottwave Forecast do not follow fundamentals news but what we follow is a system which is a combination of Elliott Wave Theory, sequences, cycles, distribution, and market correlation.
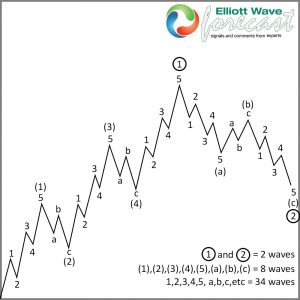
Looking at General Motors daily chart, we can see a very nice opportunity to come and we would like to share it to all followers around the World. The Elliott Wave Theory explains that after 5 waves advance there will be 3 waves back and then a continuation in favor of the 5 waves, as we presented in the following chart.

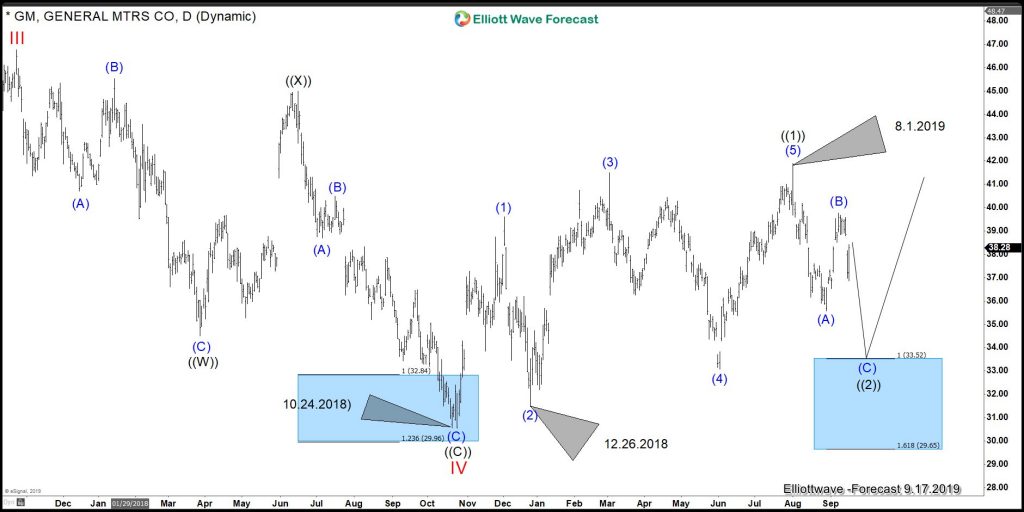
General Motors is showing the same pattern since its 10.24.2018 lows and now it is doing 3 waves back. Have a look at the following chart.
It is very interesting to see the confluence between this chart and others.
The first one is that it bottomed before the World Indices did which is ending seeing a low at the secondary low in General Motors which is reflected in the chart.
Another point is that the instrument peaked in 8.1.2019. Which is about the same for World Indices. The cycle coming from 1.8.2019 peak ended blue (A) at 36 which happened at 8.28.2019. Above from there, it ended blue (B) at 40. Below from there, it is now expected to extend lower into the equal legs of blue (A)-(B) into 33.52-29.65.
If the instrument is ending making the dip into the 33.52 area, that will draw a very nice 5 waves up followed by 3 waves back which are the most common pattern in Elliott Wave Theory.
We at Elliott Wave Forecast not only rely on the Elliott Wave Theory for the Forecast.
We explained how the DAX and GM agree in most of there highs or lows. Now the DAX is about to break its July 2019 peak and that will create a bullish sequence. However, the index needs to pullback first. So we look at that pullback, as a chance for General Motors to dip. We also explained that Idea that DJUSRE took the peak at 2007 forming a Bullish Monthly sequence and calling for more upside, which also supports the idea of General Motors rallying to come into the $46.00-$52.00 area from our Blue Box.
As we always do, we look at the Market on a technical perspective despite the strike a rally should be happening soon. Watch the video below and get an idea of our work.


