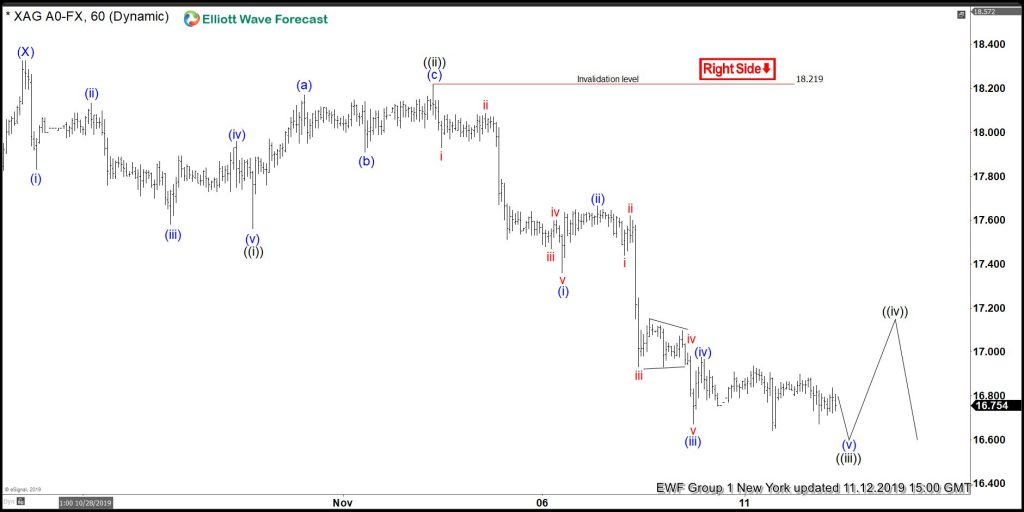
Short term Elliott Wave view suggests the rally in Silver ( $XAGUSD) to $18.32 high ended wave (X) bounce. Down from there, wave (Y) remains in progress & shows an incomplete sequence from 9/04/2019 peak ( $19.64) favoring more weakness. While the initial decline from $18.32 high unfolded in a lesser degree leading diagonal structure within wave ((i)) where wave (i) ended at $17.83. Wave (ii) bounce ended at $18.13, wave (iii) ended at $17.58, wave (iv) bounce ended at $17.95 high and wave (v) ended at $17.56 low. Up from there, wave ((ii)) bounce unfolded as a lesser degree zigzag structure where wave (a) ended at $18.17 high. Wave (b) pullback ended at $17.91 low and wave (c) ended at $18.21 high.
Down from there, wave ((iii)) remain in progress as impulse structure where wave (i) ended at $17.36 low. Above from there, wave (ii) ended at $17.66 high, wave (iii) ended at $16.67 low & wave (iv) ended at $16.97 high. Below from there, wave (v) remain in progress approximately towards $16.59-$16.47 inverse 123.6%-161.8% Fibonacci extension area of (iv) before a bounce in wave ((iv)) could be seen which is expected to fail for another leg lower to complete 5 waves decline from $18.32 high. Only if the pivot at $18.21 high gives up, wave ((v)) lower would be negated and then the decline from $18.32 high should become an Elliottwave zigzag rather than an impulse.
Silver 1 Hour Elliott Wave Chart


