
Johnson & Johnson (NYSE: JNJ) released its third-quarter earnings and revenue in mid October 2019 which beat Wall Street’s expectations. Despite facing a sell-off during that week, the stock managed to establish a major low in October and it has been rallying higher since then looking to challenge 2018 peak.
Let’s take a look at the technical picture for JNJ using Elliott Wave Theory to understand the overall structure and look for the next path :
JNJ 4H Chart
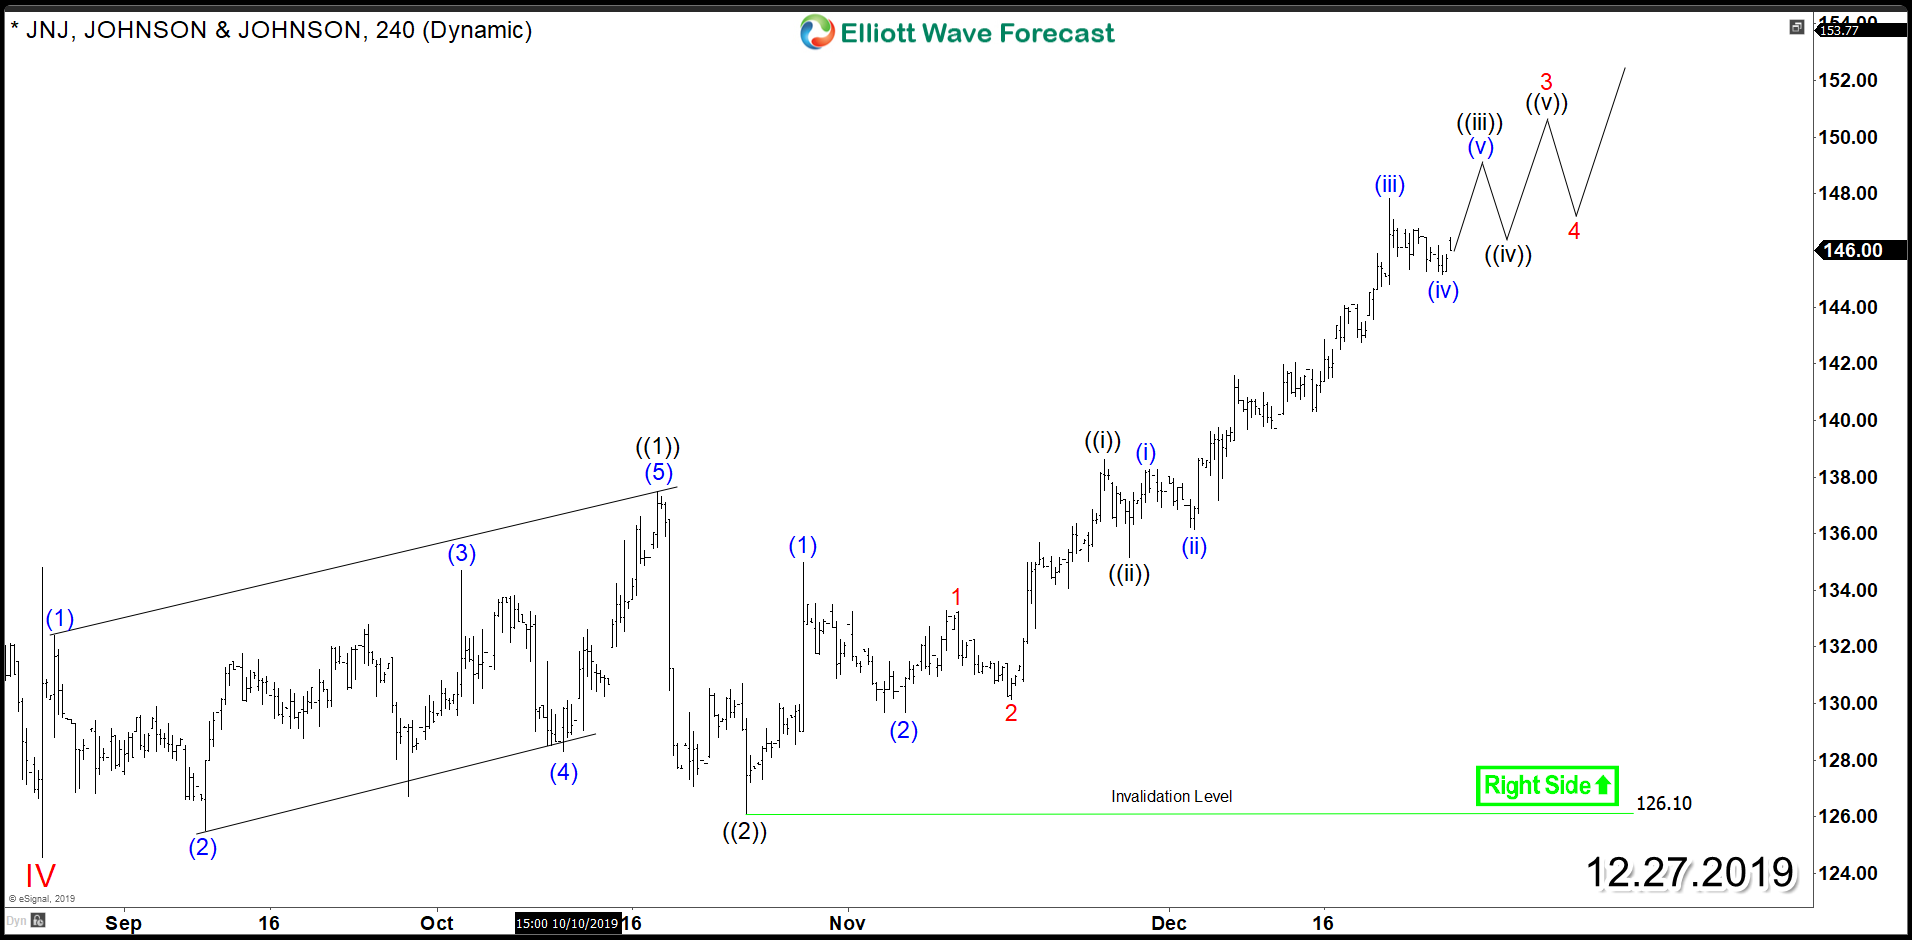
The stock is currently showing an incomplete impulsive Elliott Wave structure from August 2019 low as it managed to break above the 1.618 fib ext level $147 suggestion further continuation higher within the 3rd wave which started since 10/24/2019. Wave ((3)) is usually the strongest within the cycle, therefore JNJ is expected to remain supported above $126 and can see extension higher toward target area $152 – $158 before ending the 4 Hour cycle.
JNJ saw a sideways consolidation in the recent 2 years within a Bullish Triangle and the stock is currently in the process of breaking out of that range . It’s also approaching 2018 peak $151 and a break above that level will confirm the extension higher within the monthly cycle since 2009 low.
JNJ Weekly Chart
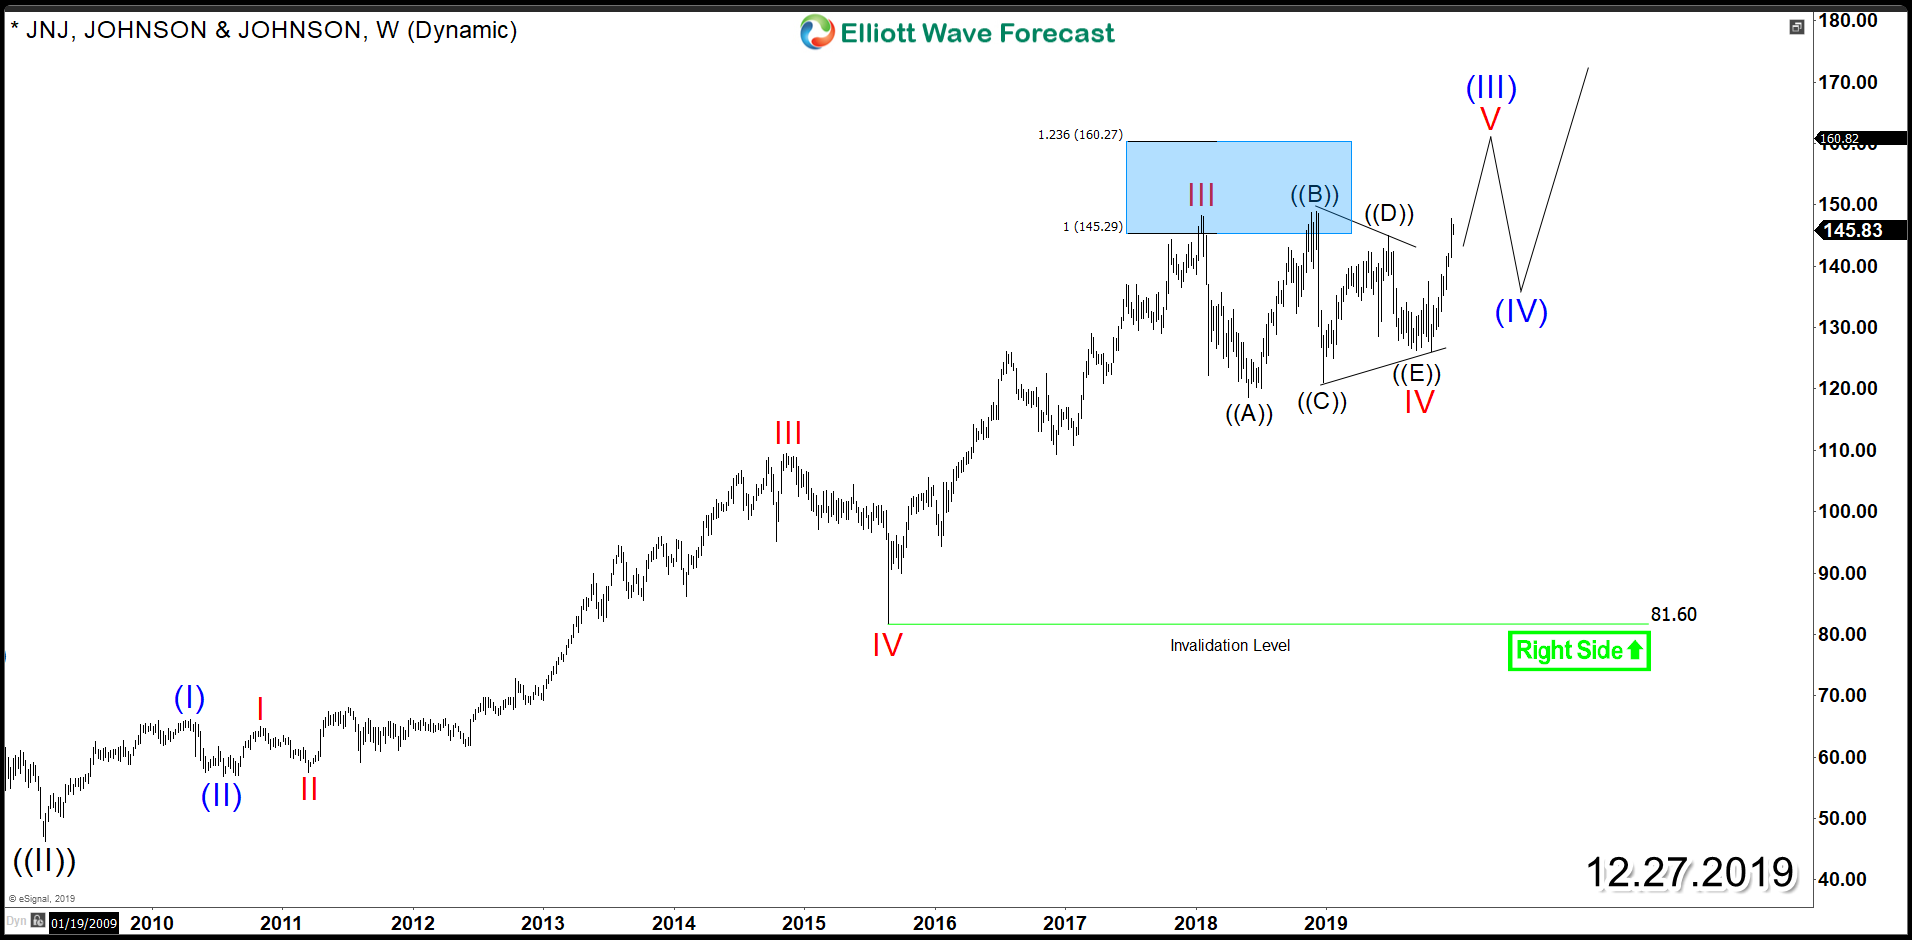
In conclusion, JNJ overall structure remains bullish as the daily cycle is still looking for further which will allow the stock to see further gains next year before a larger 3 waves pullback takes place to correct the previous cycle.