EURUSD is another forex pair that we have been trading lately . In this technical blog we’re going to take a quick look at the Elliott Wave charts of EURUSD, published in members area of the website. As our members know, EURUSD is showing higher high sequences in the cycle from the 10/01 low, calling for further strength. Consequently, we advised members to avoid selling EURUSD and keep on buying the dips in the sequences of 3,7,or 11 swings whenever get chance. In further text we’re going to explain Elliott Wave Forecast and Trading strategy.
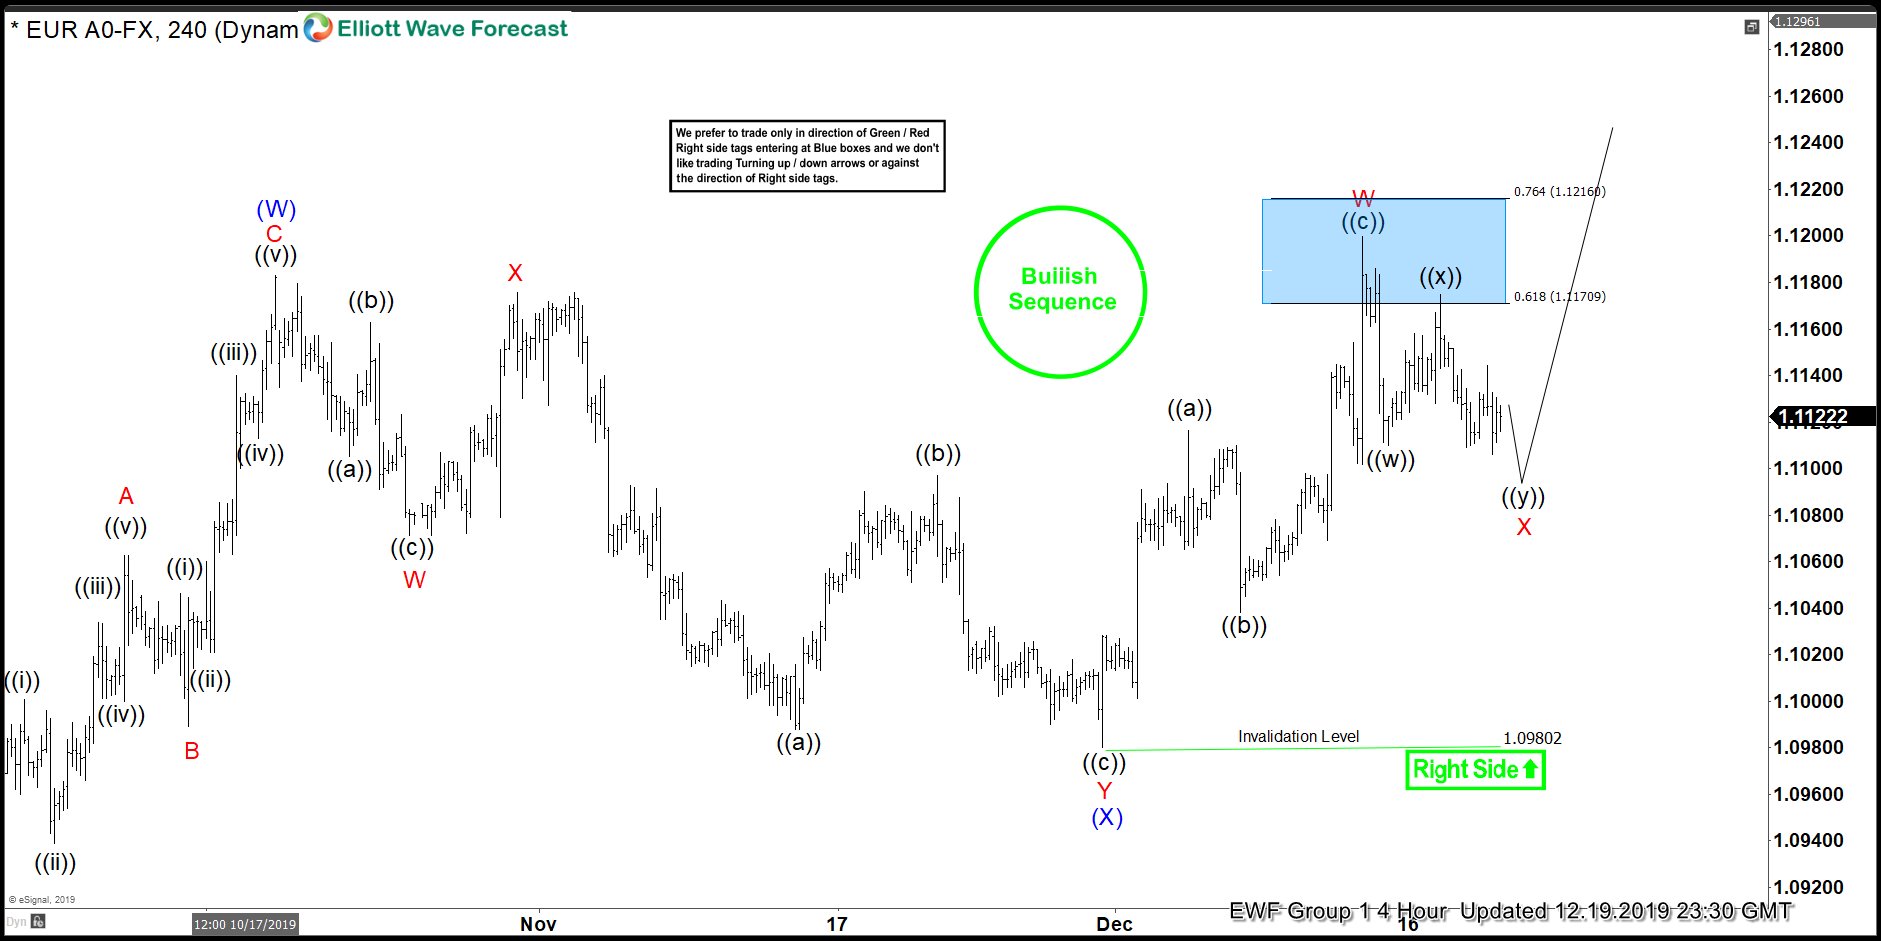
EURUSD 4 Hour Elliott Wave Analysis 12.19.2019
Cycle from the October 1st low looks incomplete now, calling for further rally in the pair ideally. Break of 10/21 peak made EURUSD bullish against the 1.0980 pivot. At this stage we don’t recommend selling the pair in any proposed pull back. Strategy is buying the pair in 3,7,11 swings against the 1.0980 low. Pull back is unfolding as Elliott Wave Double Three Pattern ( 7 swings pattern).
You can learn more about Elliott Wave Double Three Patterns at our Free Elliott Wave Educational Web Page.
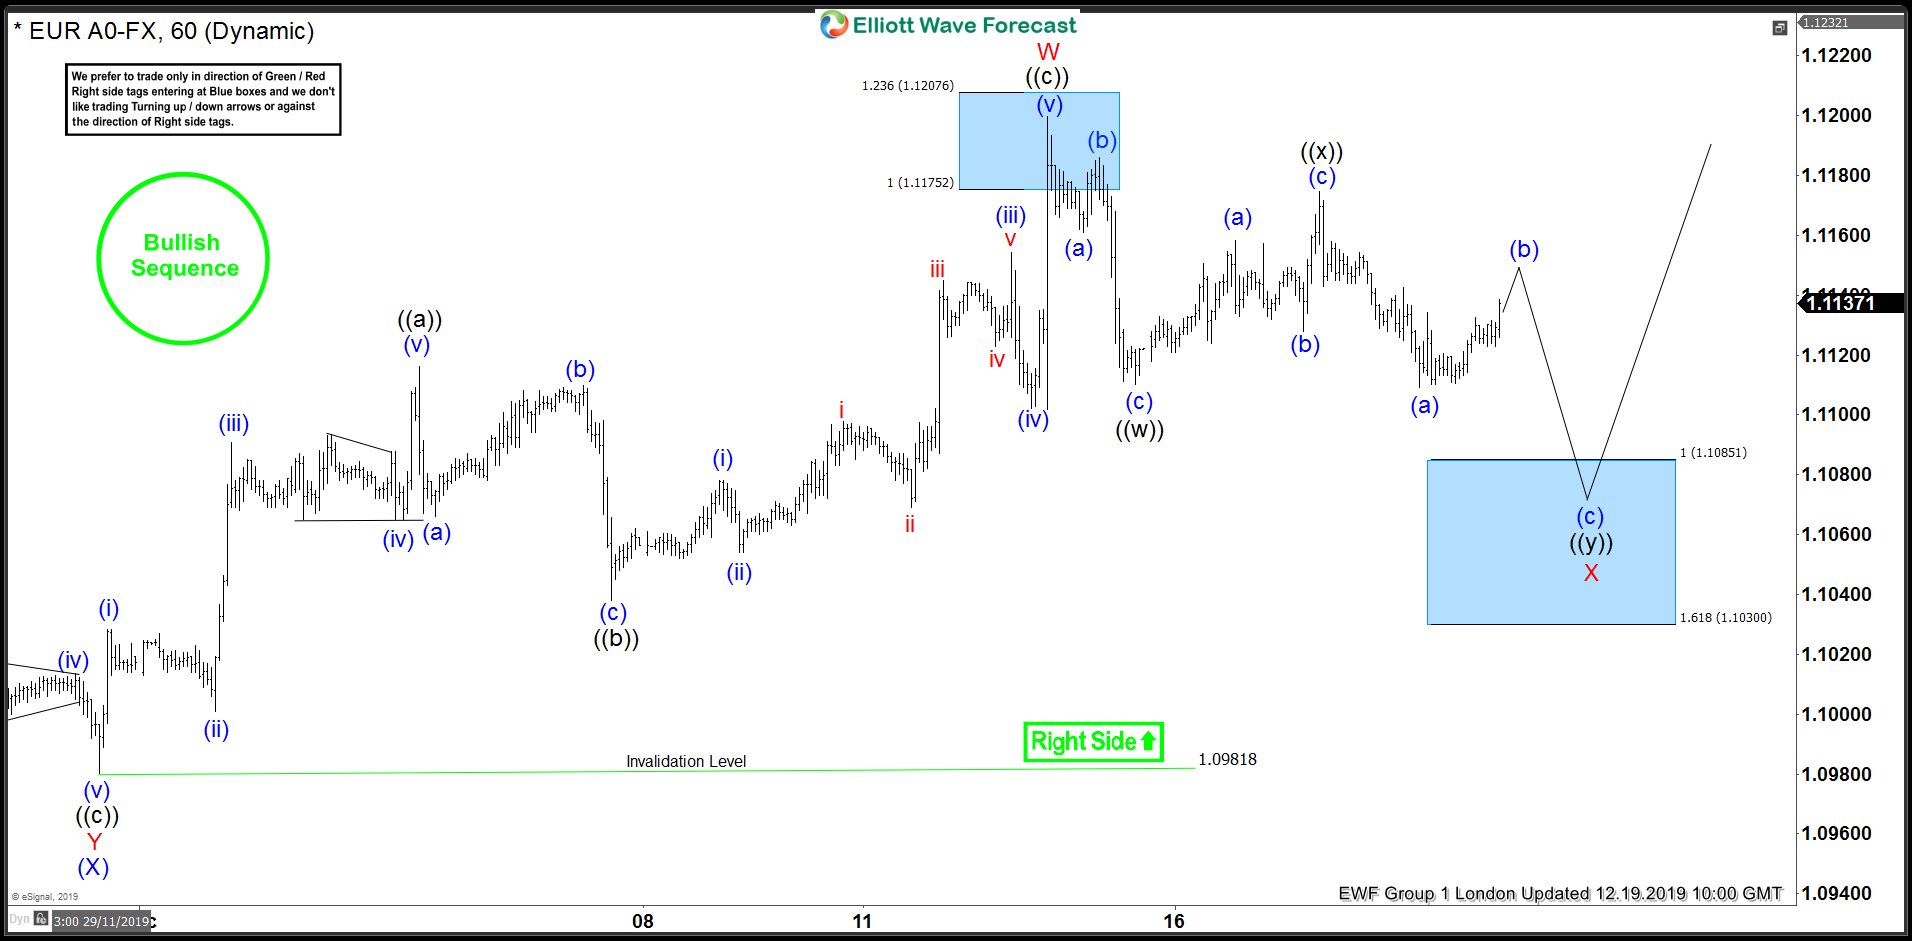
EURUSD 1 Hour Elliott Wave Analysis 12.19.2019
At this stage pull back looks incomplete. It’s showing 5 swings down from the peak. We expect to see another leg down toward 1.1085-1.1030 (buyers area) where it should ideally complete 7 swings . At the marked zone buyers should appear for proposed rally or 3 wave bounce at least. We don’t recommend selling the pair and favor the long side – buying the pair at the blue box. As our members know Blue Boxes are no enemy areas , giving us 85% chance to get a bounce.
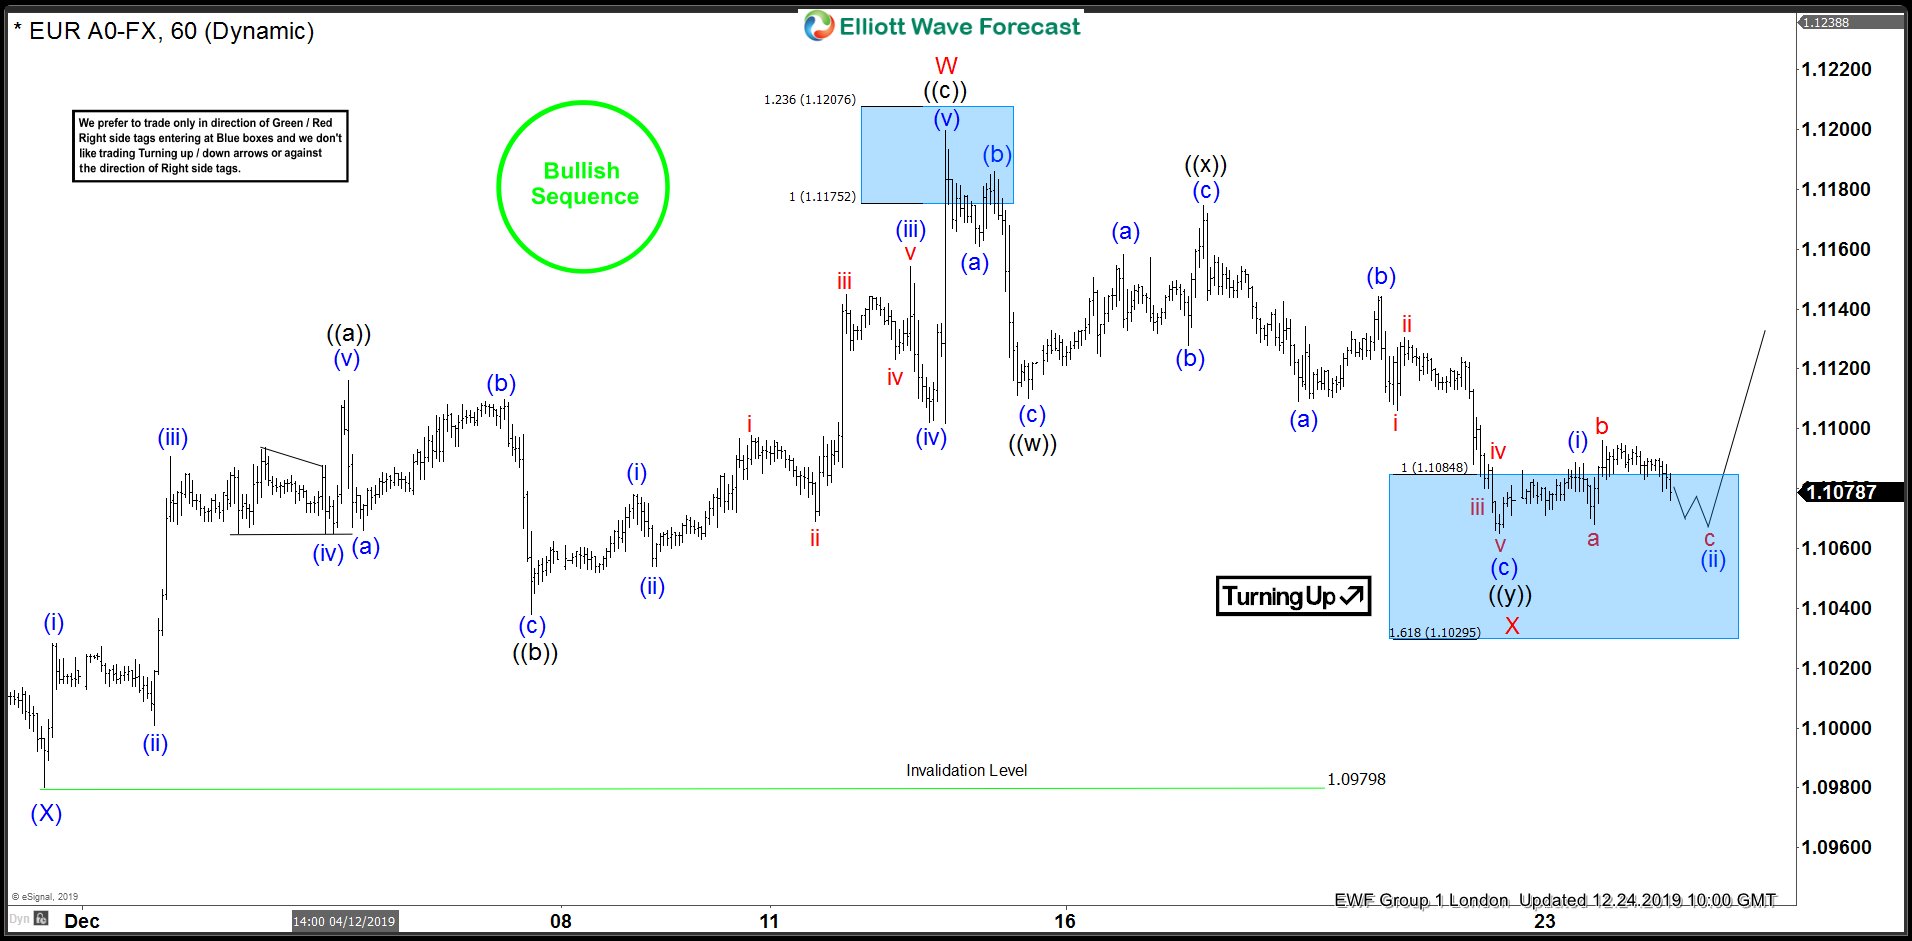
EURUSD 1 Hour London Elliott Wave Analysis 12.24.2019
EURUSD made 7th swing down and reached ((w))-((x)) equal legs- buying zone at 1.10848-1.10295. Buyers appeared at the blue box and the price is already showing reaction from there. We are calling X red pull back completed at 1.1064 low, although bounce is still shallow. Now, we need to see further separation up from that low to get confirmation we have ended cycle from the peak. EURUSD should ideally see break above 12/13 peak to get confirmation next leg up is in progress. Anyway at least 3 waves bounce should be seen as h1 trend is bullish. As soon as the pull back reaches 50 fibs against the ((x)) black high, we will make long positions risk free. Invalidation for buyers positions is break below 1.618 fib extension: 1.10295.
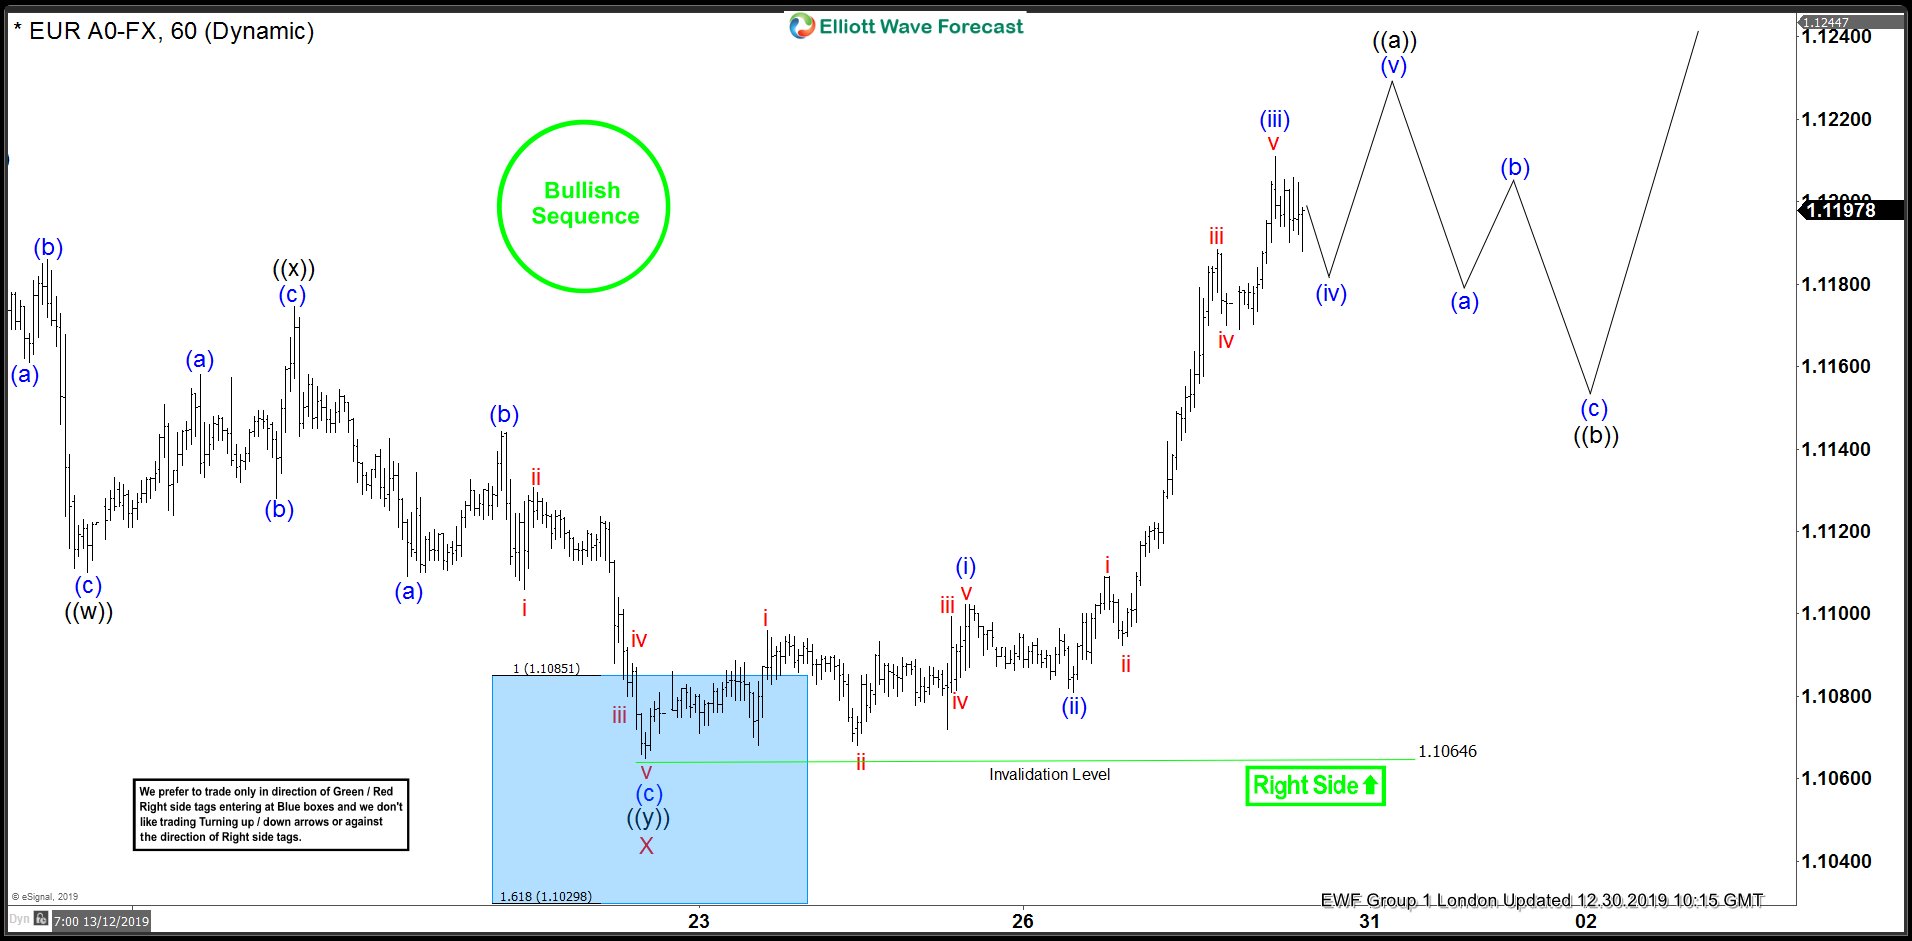
EURUSD 1 Hour London Elliott Wave Analysis 12.30.2019
We got expected separation from the low. Mentioned 1.1064 low held nicely and we got nice rally when the price eventually broke previous peak. The break above 12/13 peak has made the pair bullish against the 1.10646 low. Members who took long positions from the blue box should be already risk free.
It’s crucial to fully understand our official strategy: trading the equal legs and sequences in 3,7,11 swings. Combined with Trend Trading it gives you very powerful system that protects your account and makes you profit. If not already familiar with this strategy, all you have to do is to sign up for 14 days Free Trial and watch our Free Educational Video in membership area. If still having some questions after watching it, feel free to let us know and we will help. You can ask questions in 24 Hour Chat Room and in Live Analysis Sessions.


