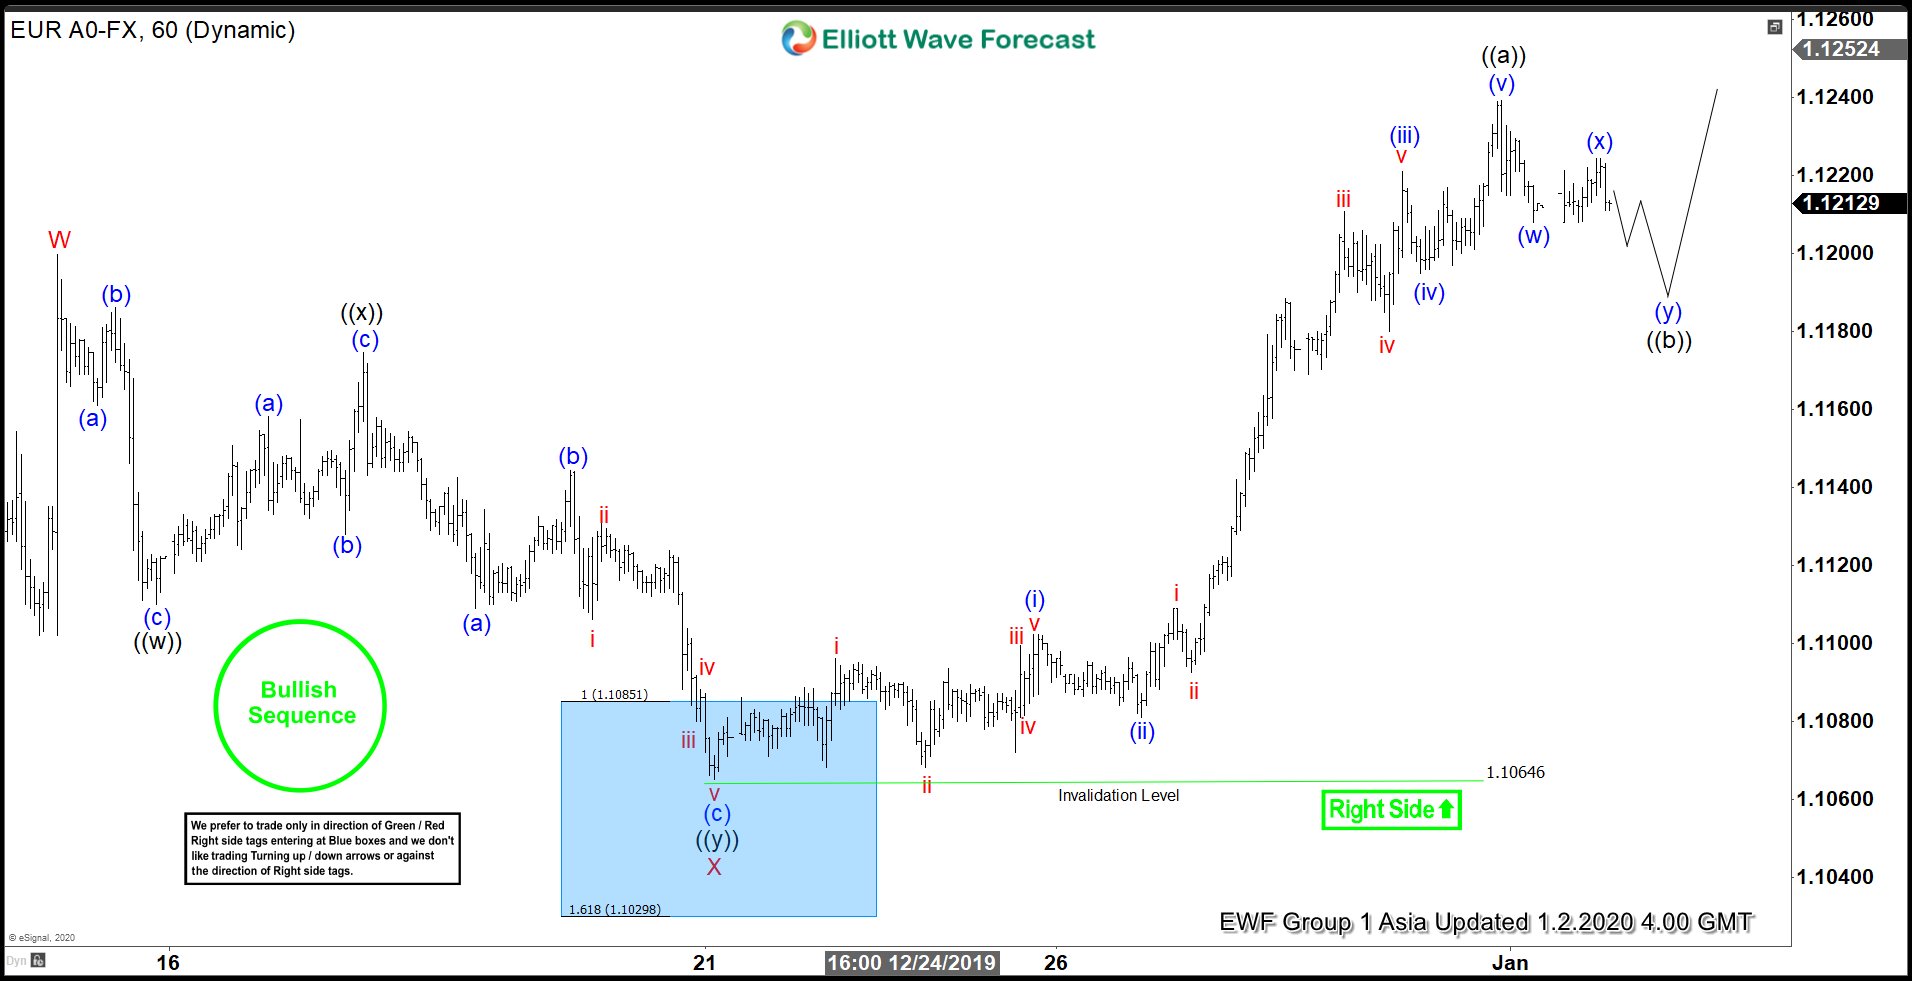
Short Term Elliott Wave view in $EURUSD suggests that the cycle from October 1, 2019 low remains incomplete and pair can see further upside. Near term, pullback to 1.1064 on December 21, 2019 low ended wave X. Pair has resumed higher in wave Y with subdivision unfolding as a zigzag Elliott Wave structure. Wave ((a)) of Y ended at 1.1239 as 5 waves impulsive Elliott Wave structure. Up from 1.1064, wave (i) ended at 1.11023 and wave (ii) pullback ended at 1.1081. Pair then resumes higher again in wave (iii) towards 1.122, and wave (iv) pullback ended at 1.1195. The last leg wave (v) ended at 1.1239 and this completed wave ((a)) as well.
Pair is currently proposed to be correcting the cycle from December 21, 2019 low within wave ((b)) before the rally resumes. The pullback should unfold in the sequence of 3, 7, or 11 swing and as far as pivot at 1.1064 low stays intact, expect buyers to appear and pair to extend higher. The near-term support area comes at 1.1175 – 1.1194 which is the 100%-123.6% fibonacci extension area where wave (y) is equal to wave (w).
$EURUSD 1 Hour Elliott Wave Chart


