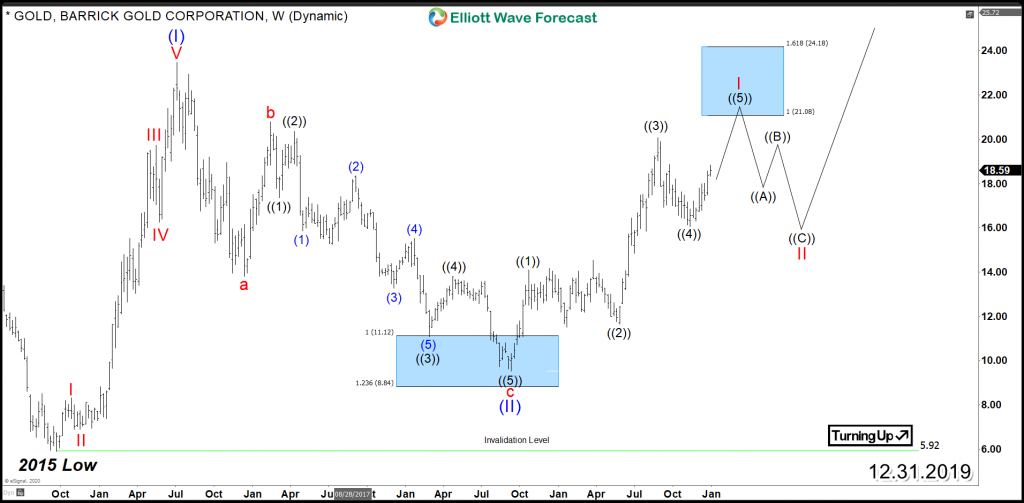
Barrick Gold Corporation (NYSE: GOLD) is the second-largest gold mining company in the world. As the precious metal price has been soaring recently, let’s take a look at the technical structure of the stock.
GOLD established a major low back in September 2015 from where the stock rallied strongly within an impulsive 5 waves advance which was followed by a technical 3 waves zigzag structure into equal legs area $11 – $8. Up from there, it started a new bullish cycle aiming for an upside target at $21 – $24 before another 3 waves pullback takes place which is expected again to find support before the trend resumes higher. The blue boxes presented in charts are a High-frequency areas where the instrument is likely to end cycles and make a turn in favor of the previous cycle.
Barrick Gold still needs to break above 2016 peak to open a higher highs sequence and establish a strong bullish trend where buyers will be looking to jump into any pullback in 3 or 7 swings looking for further rallies.


