Singapore Dollar SGD tumbled last week after Monetary Authority of Singapore (MAS) suggests that Singapore Dollar has room to depreciate. The statement came after the coronavirus infection spread to the territory and the central bank predicts it will hit growth. This comes after the economy shows signs of recovering from last year’s weakest growth in a decade. Unlike other central banks, MAS manages policy through exchange rate bands. This band is not disclosed and MAS will let SGD to rise or fall within the closely-guarded bands.
In their statement, MAS indicated there’s sufficient room within the policy band to accomodate an easing in line with the weakening of economic conditions. It dropped as much as 0.9% last week to $1.382 against the U.S Dollar after the announcement. The currency will likely remain under pressure as markets price in easing.
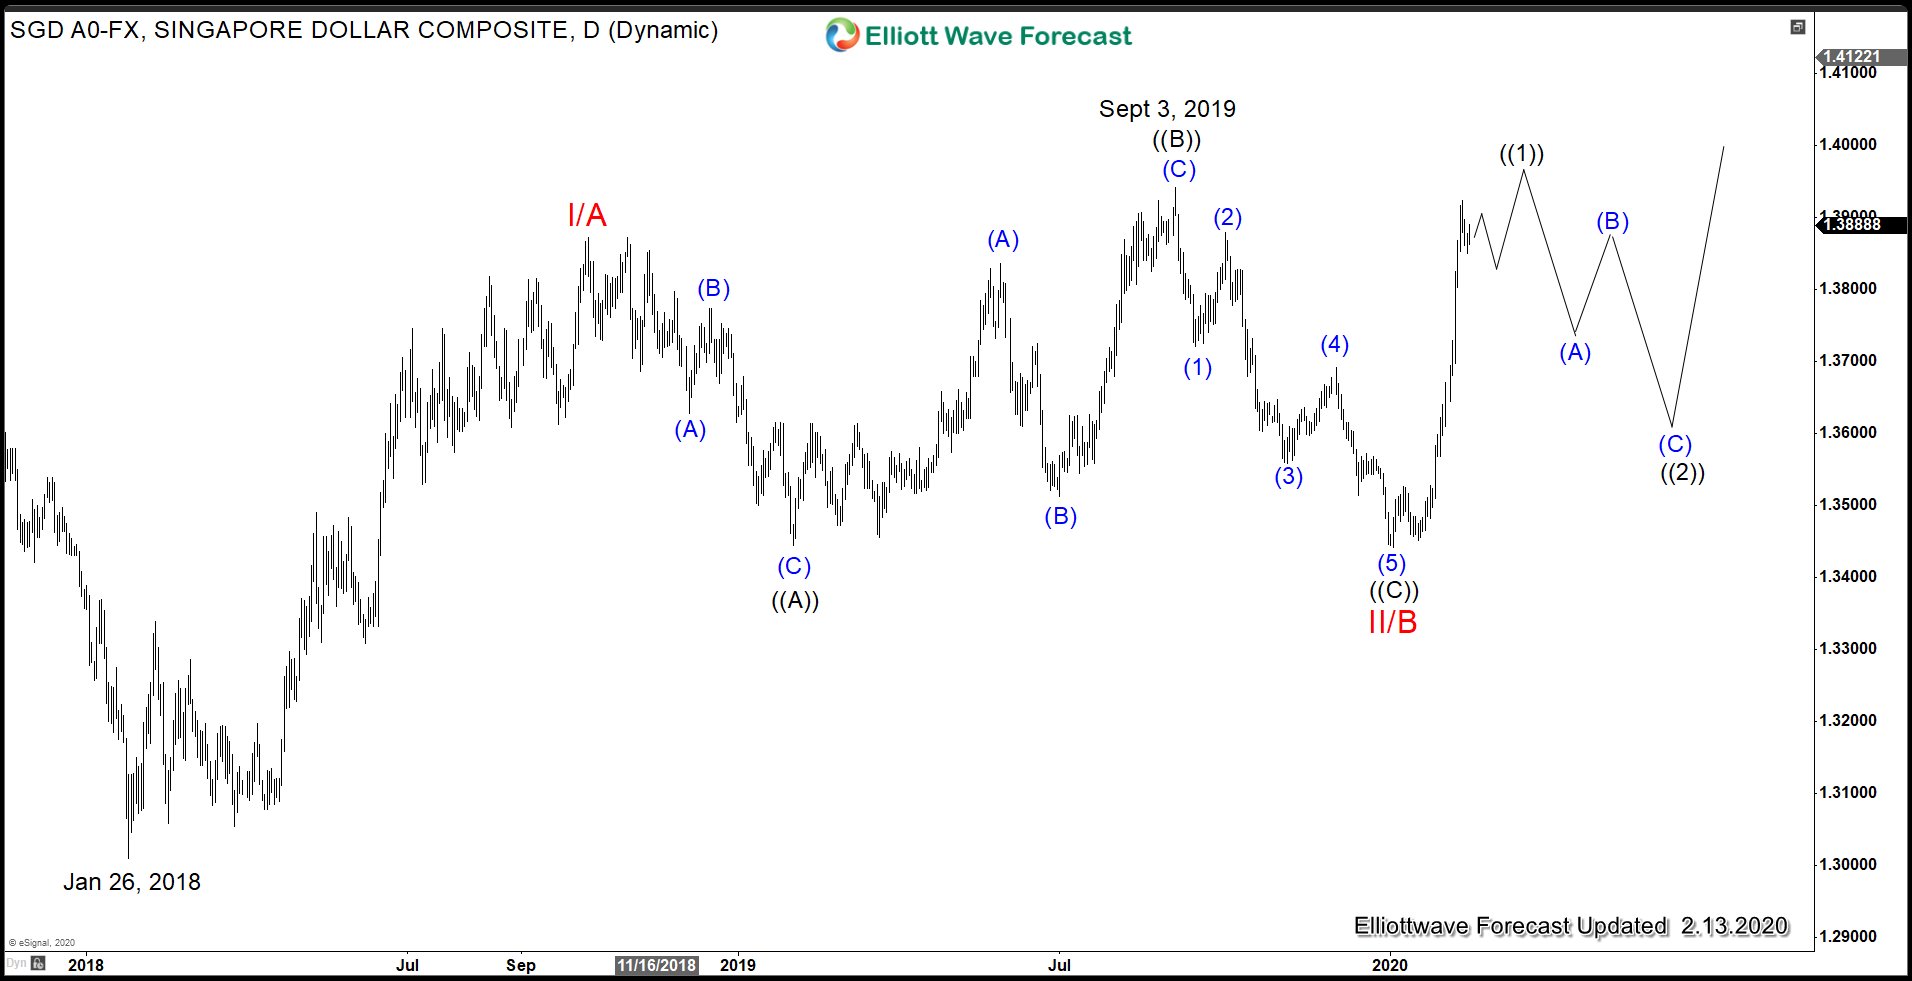
USD/SGD Daily Elliott Wave Sequence

Daily Elliott Wave chart above shows the pair is close to breaking above Sept 3, 2019 high (1.394). A break above that level will create a bullish sequence from January 26, 2018 low and confirm that the next leg higher within wave III / C to have started. Wave ((1)) rally from January 2, 2020 low (1.344) also looks impulsive and later wave ((2)) pullback should continue to find support in 3, 7, or 11 swing against 1.344 for more upside. We don’t like selling the pair and favor further upside as far as pivot at 1.344 low stays intact.
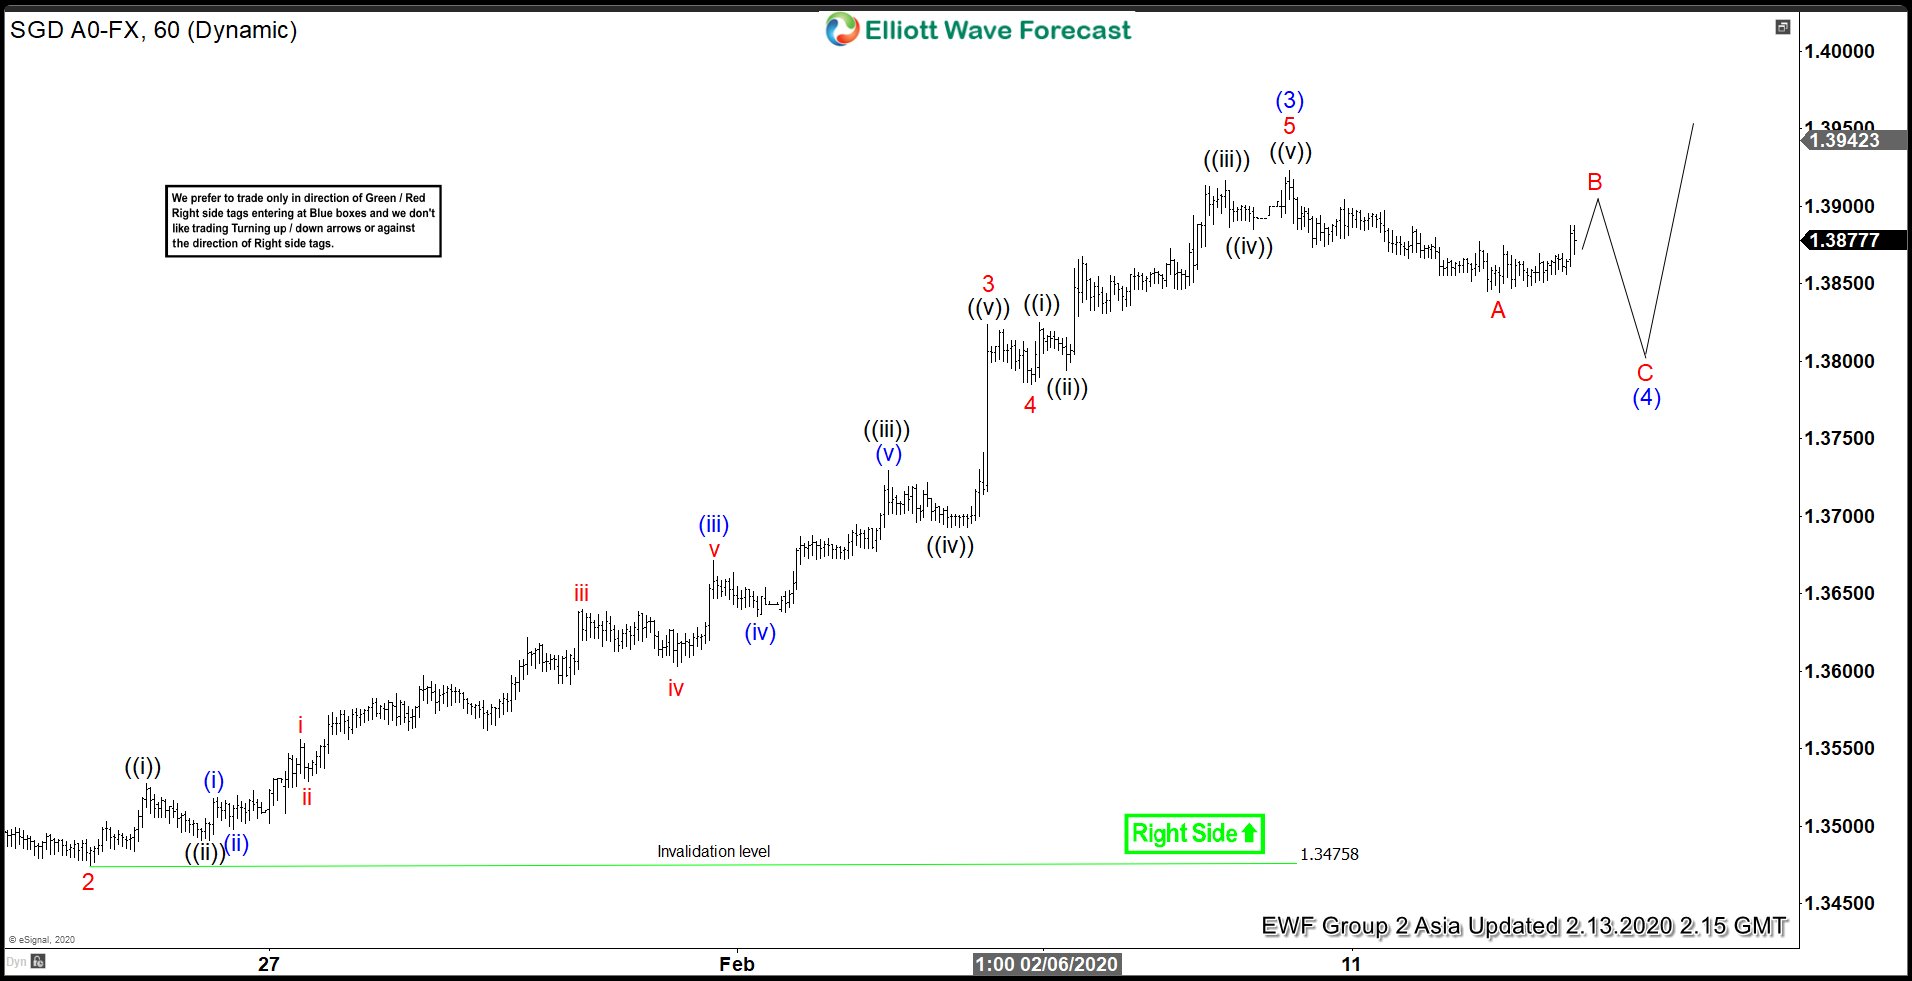
USD/SGD 1 hour Elliott Wave Outlook

Short term 1 hour chart of USDSGD above suggests pair has scope to extend 1 more leg higher before ending 5 waves up from Jan 3, 2020 low. Wave (4) pullback is currently in progress in 3, 7, or 11 swing before pair resumes higher. As far as pivot at 1.347 low stays intact, expect pair to extend higher 1 more time. If the pair does extend higher in wave (5) and breaks above September 3, 2019 high, then the bullish sequence from January 2018 low will be confirmed.

