Bausch Health (Ticker: BHC) reported Q4 revenue of $2.22 billion, which is a 5% YoY increase. The result was slightly higher than the consensus estimate of $2.2 billion. The company also reported a $1.51 billion net loss, or $4.3 per share using Generally Accepted Accounting Principle (GAAP). This is a significant drop compared to the net loss of $344 million, or 0.98 per share in Q4 2018. Non-GAAP Q4 net income rose to $404 million, a 10% YoY increase or $1.15 per share. This compared to non-GAAP earnings of $1.05 / share in Q4 2018.
The GAAP net loss in Q4 is primarily due to the accrual of legal reserves for litigation. The company sets up this reserves to settle a Valeant stock drop lawsuit that hit investors in 2015. The non-GAAP EPS adjusted out this figure which brings the profit up. Moving forward, the company gave a guidance of a full year revenue of $8.65 – 8.86 billion in 2020. The guidance on Adjusted Earnings before interest rates, depreciation and amortization (EBITDA) came at $3.5 – 3.65 billion.
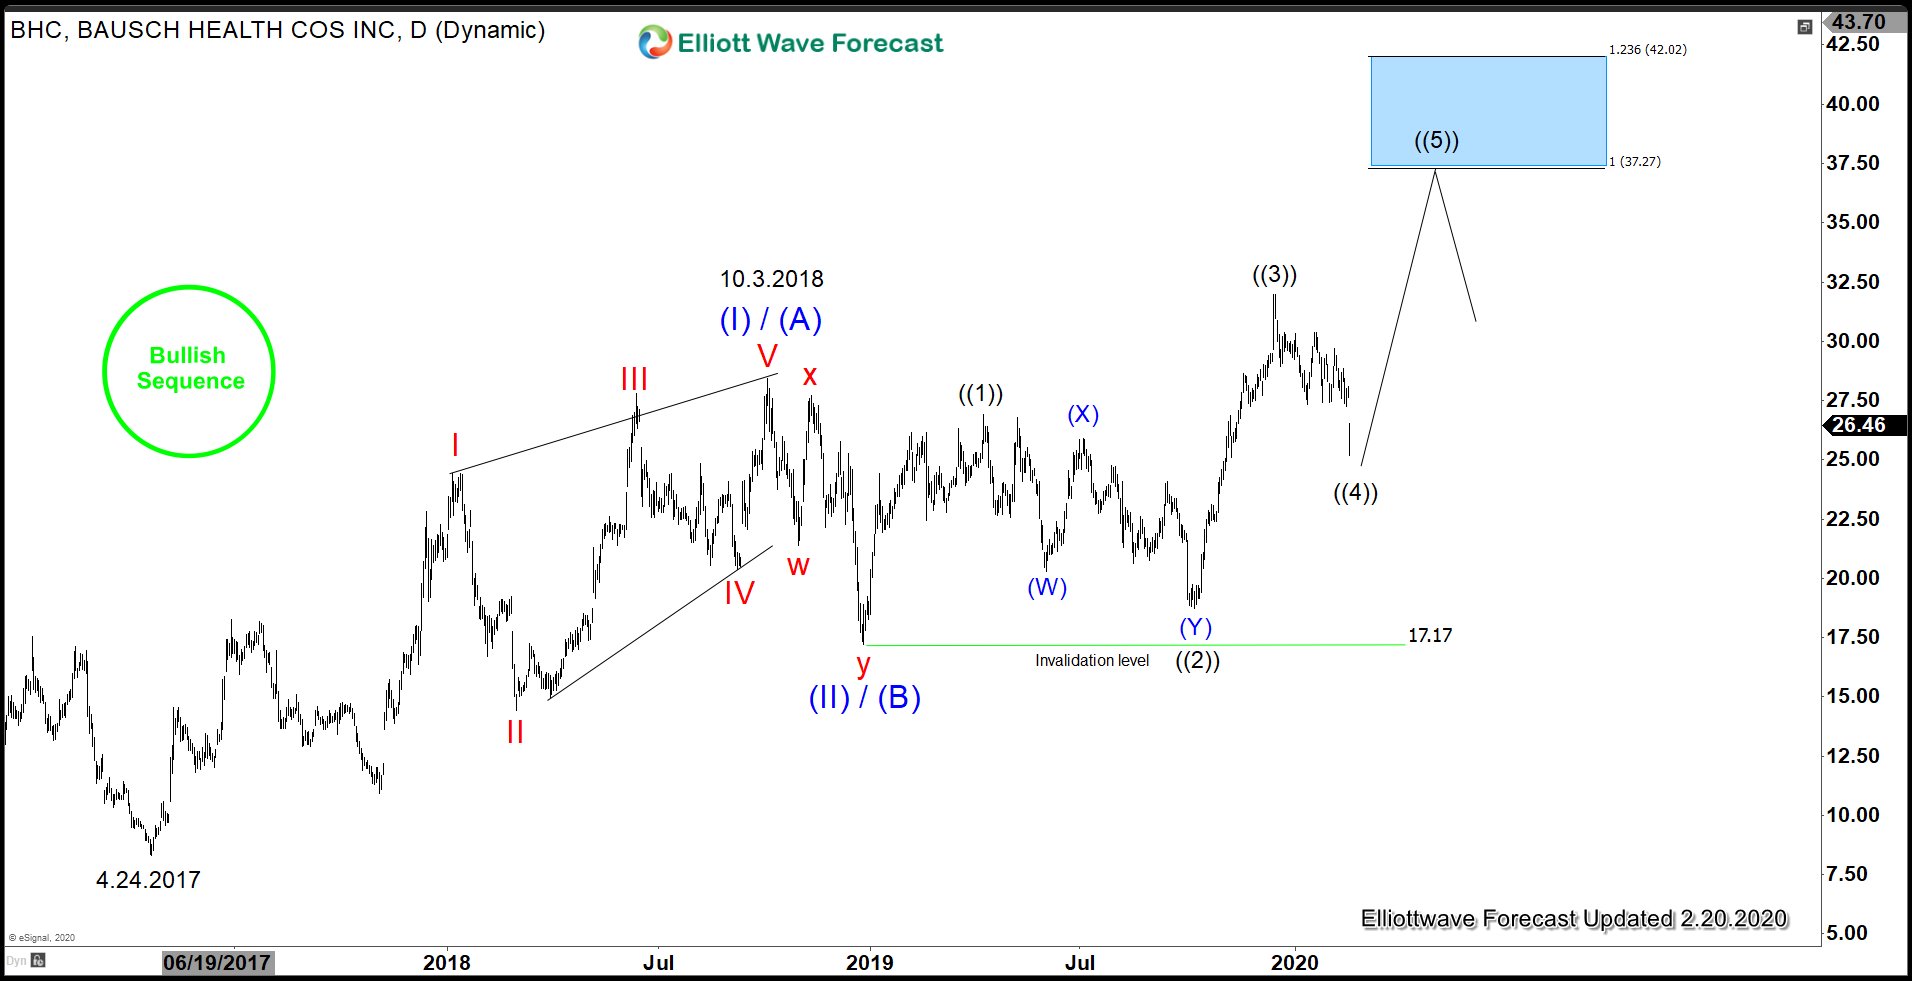
BHC Daily Elliott Wave Chart

Daily Elliot Wave chart above suggests the stock has incomplete sequence from 4.24.2017 low. A 100% extension from April 2017 should see the stock reaching $37.2 – $42 area. Furthermore, if we are correct that the rally from 4.24.2017 low to 10.3.2018 high is in 5 waves diagonal, then we also need at least a 5 waves move higher from 12.26.2018 low ($17.17). So far the rally from $17.17 low is only in 3 waves, thus another leg higher is possible as far as the stock stays above $17.17.
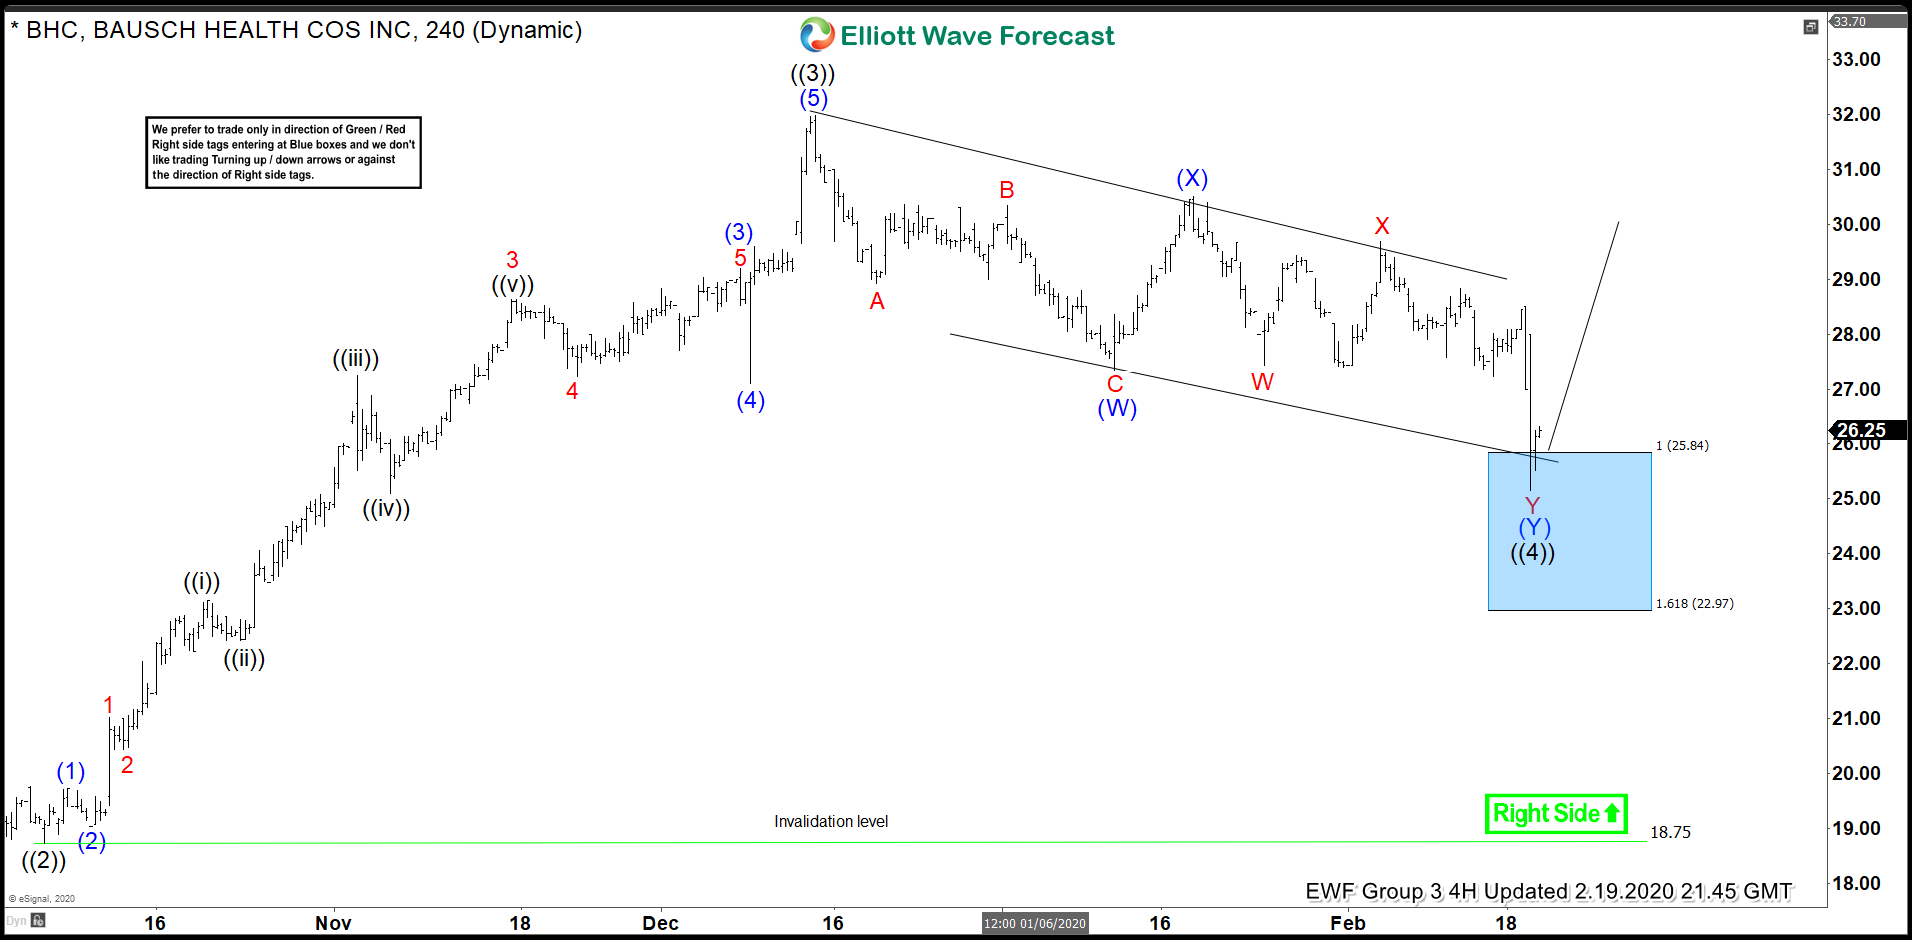
BHC 4 Hour Elliott Wave Chart

Looking at the 4 hour chart above, decline from wave ((3)) high on 12.13.2019 appears corrective. It has overlapping characteristic and stays within a well-defined channel. The cycle from 12.13.2019 high now shows a complete 100% extension in 7 swing at the blue box. As far as the invalidation level at $18.75 low holds, the stock has a chance to start bouncing soon in 3 waves at least if not extending higher.

