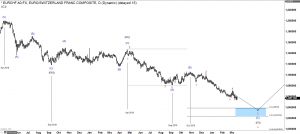
Here, I am going to take a look on weekly and daily charts of Euro Swissy $EURCHF. In a quiet natural way, this cross is a ratio of two pairs: $EURUSD and $USDCHF. In weekly time frame, the pair $EURCHF shows a strong positive correlation to $USDCHF which is currently turning up. We expect the latter to rally for next months to years to end correction up of a cycle lower of higher degree. In this rally to come, Euro Swissy is lagging as 1) it needs to accomplish its own pattern and 2) $EURUSD on the weekly favors a bit more downside before turning up.
Swissy Weekly Elliott Wave Analysis 03.17.2020
As demonstrated on the weekly chart below, the cycle up from the January 2015 lows has printed a top on April 2018. It shows 5-3-5 structure which can be an Elliott wave zigzag pattern. From 2018 highs, we observe a choppy decline which favors the correction scenario rather than an impulse to the downside. Therefore, I denote the zigzag up as a cycle wave w in red and the weakness from 2018 highs as a cycle wave x being still in progress. Once the corrective cycle lower is finished, a push higher in a cycle red wave y can be expected.

Swissy Daily Elliott Wave Analysis 03.17.2020
In addition, the daily chart below reveals the correction from April 2018 highs to develop as a double three pattern. The cycle lower in black wave ((W)) has ended on September 2018. Afterwards, the wave ((X)) has finished correcting the cycle lower on April 2019. From there, 3rd leg lower in ((Y)) has reached already the equal legs extension area of the wave ((W)) (not shown). However, the internals of the wave ((Y)) may see an equal legs extension as well before $EURCHF will turn higher. Namely, while below 1.071, Euro Swissy may extend lower in blue wave (C) from October 2019 highs to the Blue Box (s. weekly/daily) towards 1.039-1.023 area to reach the equal legs area with the blue wave (A) from April 2019 highs. From there, Swissy can finally resume the rally to the new highs or can see a 3 waves bounce at least.


