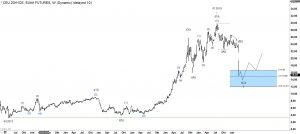
European Union Carbon prices occupy the brains of public in Europe since many years. Under EU guidelines, participating organizations have to purchase the emission allowances from others or they can sell their leftovers. This has to occur, therefore, in function of the efficiency of reducing greenhouse gases by every participant. Ideally, the future prices on carbon emissions $EUA should depend on fundamentals: politics, real economy etc. A quick view on the chart below, however, shows that that is not the case. Indeed, the prices demonstrate clearly recognizable Elliott Wave patterns representing the mass psychology of the traders. Therefore, it is a further example of a price chart where a technical analysis may give an answer on what may happen next.

Carbon Prices Weekly Elliott Wave Analysis 03.24.2020
Weekly Chart of $EUA Futures above shows a cycle up in red wave 1 of a cycle degree from April 2013 lows which has printed a top on July 2019 at 30 € / t CO2. One can recognize the cycle internals as 5-3-5-3-5 impulsive Elliott Wave structure with an extension in the black wave ((3)). Even though rare within the same cycle, both the waves ((1)) and ((5)) apear to unfold as diagonal structures.
From the July 2019 highs, the carbon prices have pulled back in an impulsive wave ((A)). Thereafter, sideways action in form of a converging triangle ((B)) has resolved in a thrust lower as wave ((C)) below 16 €. 5 waves up from 2013 lows and 3 waves lower from 2019 highs call for another swing higher. This is required to complete the bullish sequence. Alternatively, it may extend as a red wave 3 of an impulse to the upside. Such an acceleration would ultimatively call for a wave 4 and a wave 5 within a larger cycle.
Carbon Prices Outlook
As for now, the extension in black wave ((C)) has already reached the equal legs area with the black wave ((A)) at 16.6 – 12.0. From the blue box area (s. chart), where the buyers are expected to enter the market, the price is expected to bounce to resume the rally to the new highs above 30 € towards 40-45 € area. If the bounce would, however, fail in 3 waves, another low in a double three pattern may happen. Since the correction lower has already retraced more than 50% of the cycle up, a double three is less probable.
