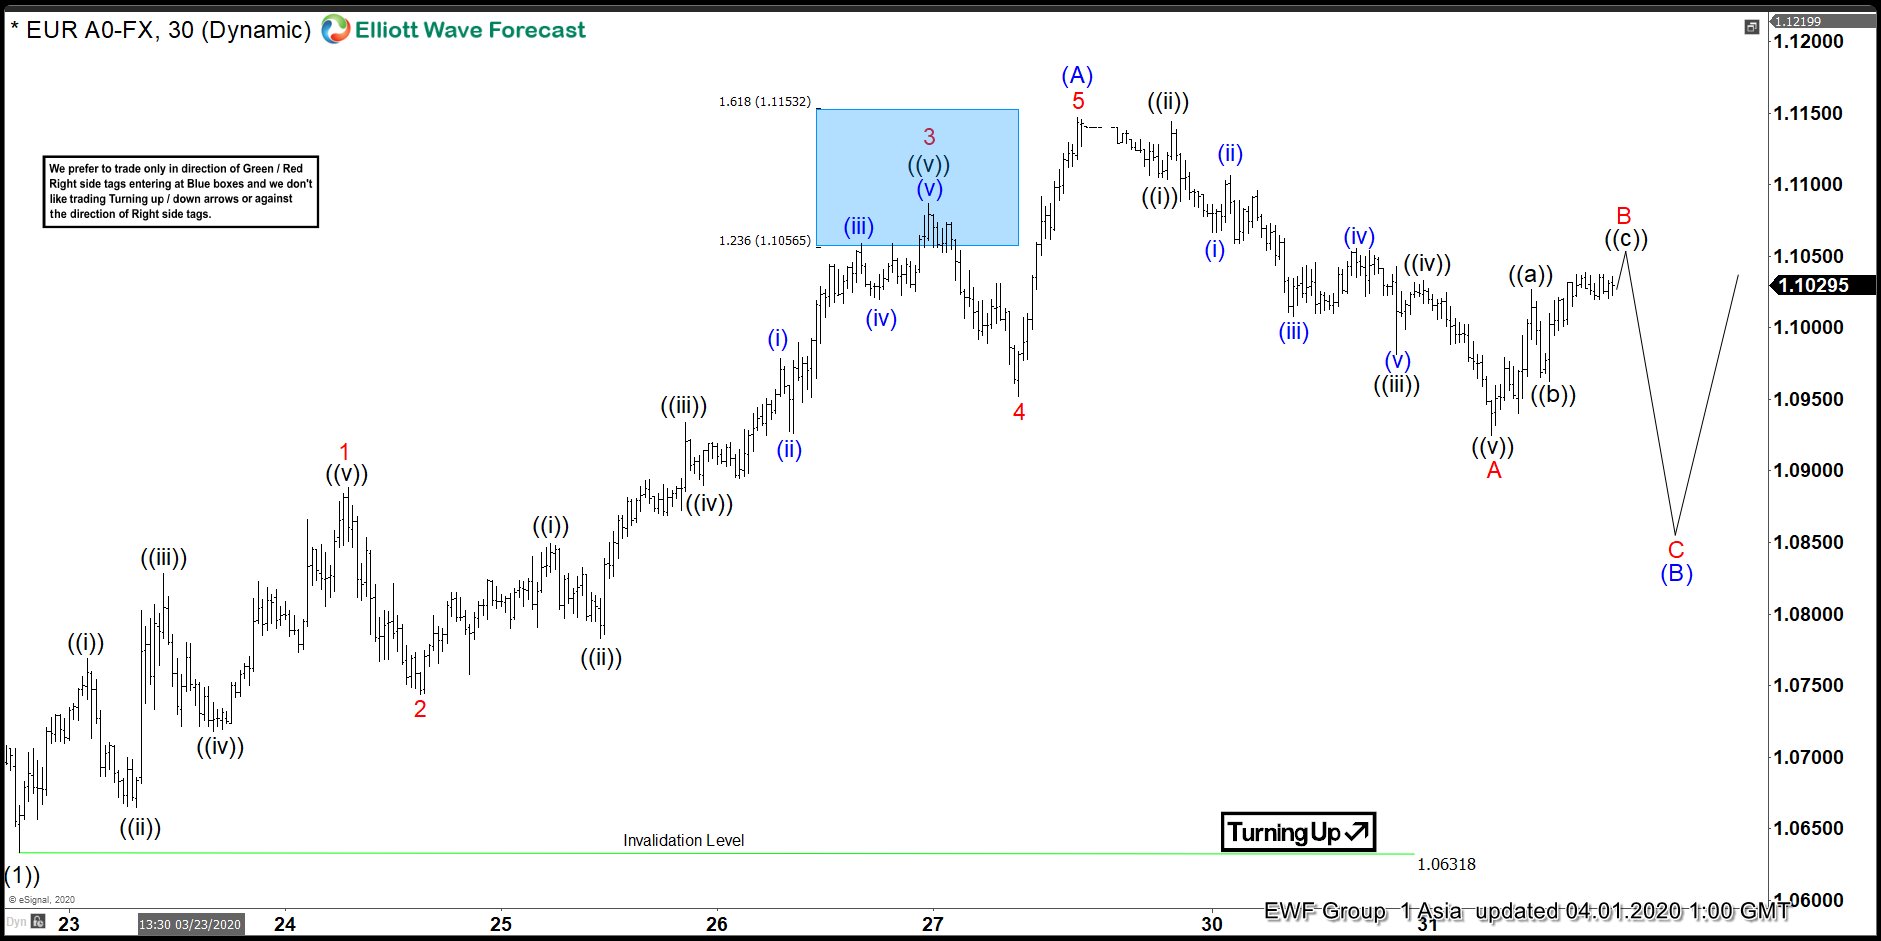
EURUSD shows an incomplete sequence from Feb 16, 2018 high favoring further downside while below March 9 high (1.1496). Near term, the decline from March 9, 2020 high (1.1496) ended wave ((1)). Bounce in wave ((2)) is unfolding as a zigzag Elliott Wave structure where wave (A) ended at 1.1147. Internal of wave (A) unfolded as a 5 waves impulse. Up from March 23 low (1.063), wave 1 of (A) ended at 1.088 and pullback in wave 2 of (A) ended at 1.074. Pair resumes higher in wave 3 of (A) towards 1.1086, and wave 4 of (A) pullback ended at 1.0952. Final leg wave 5 of (A) ended at 1.1147.
Wave (B) pullback remains in progress as a zigzag where wave A ended at 1.092. as 5 waves. Down from 1.1147, wave ((i)) of A ended at 1.1103, and wave ((ii)) of A ended at 1.114. Wave ((iii)) of A ended at 1.098 and wave ((iv)) of A bounce ended at 1.103. Final leg wave ((v)) of A ended at 1.092. While wave B bounce fails below 1.1147, expect pair to extend lower in wave C of (B) before turning higher again in wave (C). As far as the pullback stays above 1.063, expect pair to extend higher to continue the rally to correct cycle from March 9, 2020 high.
EURUSD 1 Hour Elliott Wave Chart


