In this article, we will look at DELTA AIRLINES (DAL) to make sense of the recent huge volatility in the stock market caused by Corona virus pandemic which has now spread to over 200 countries in the World. The financial markets made huge declines but as is often the case, some sectors always get hit the hardest when compared to others. The transportation sector got hit a lot harder than the other sectors with Airlines and Cruise stocks being some of the biggest losers. Companies like Royal Caribbean, General Motors, Boeing, Carnival Cruise Line, American Airlines, Delta Airlines are among some of the stocks which got hit the hardest.
We at Elliottwave-Forecast have been tracking all the above stocks and they are all in Grand Super cycle correction except for American Airlines which appears to be correcting Super cycle from 2009. Delta Airlines got hit so hard that it looks like a plane has Crash landed, let’s take a look at the analysis below to see whether the Delta Airlines (DAL) crashed or it survived and it’s ready for take off again.
DELTA AIRLINES (DAL) Long-Term Elliott Wave Analysis
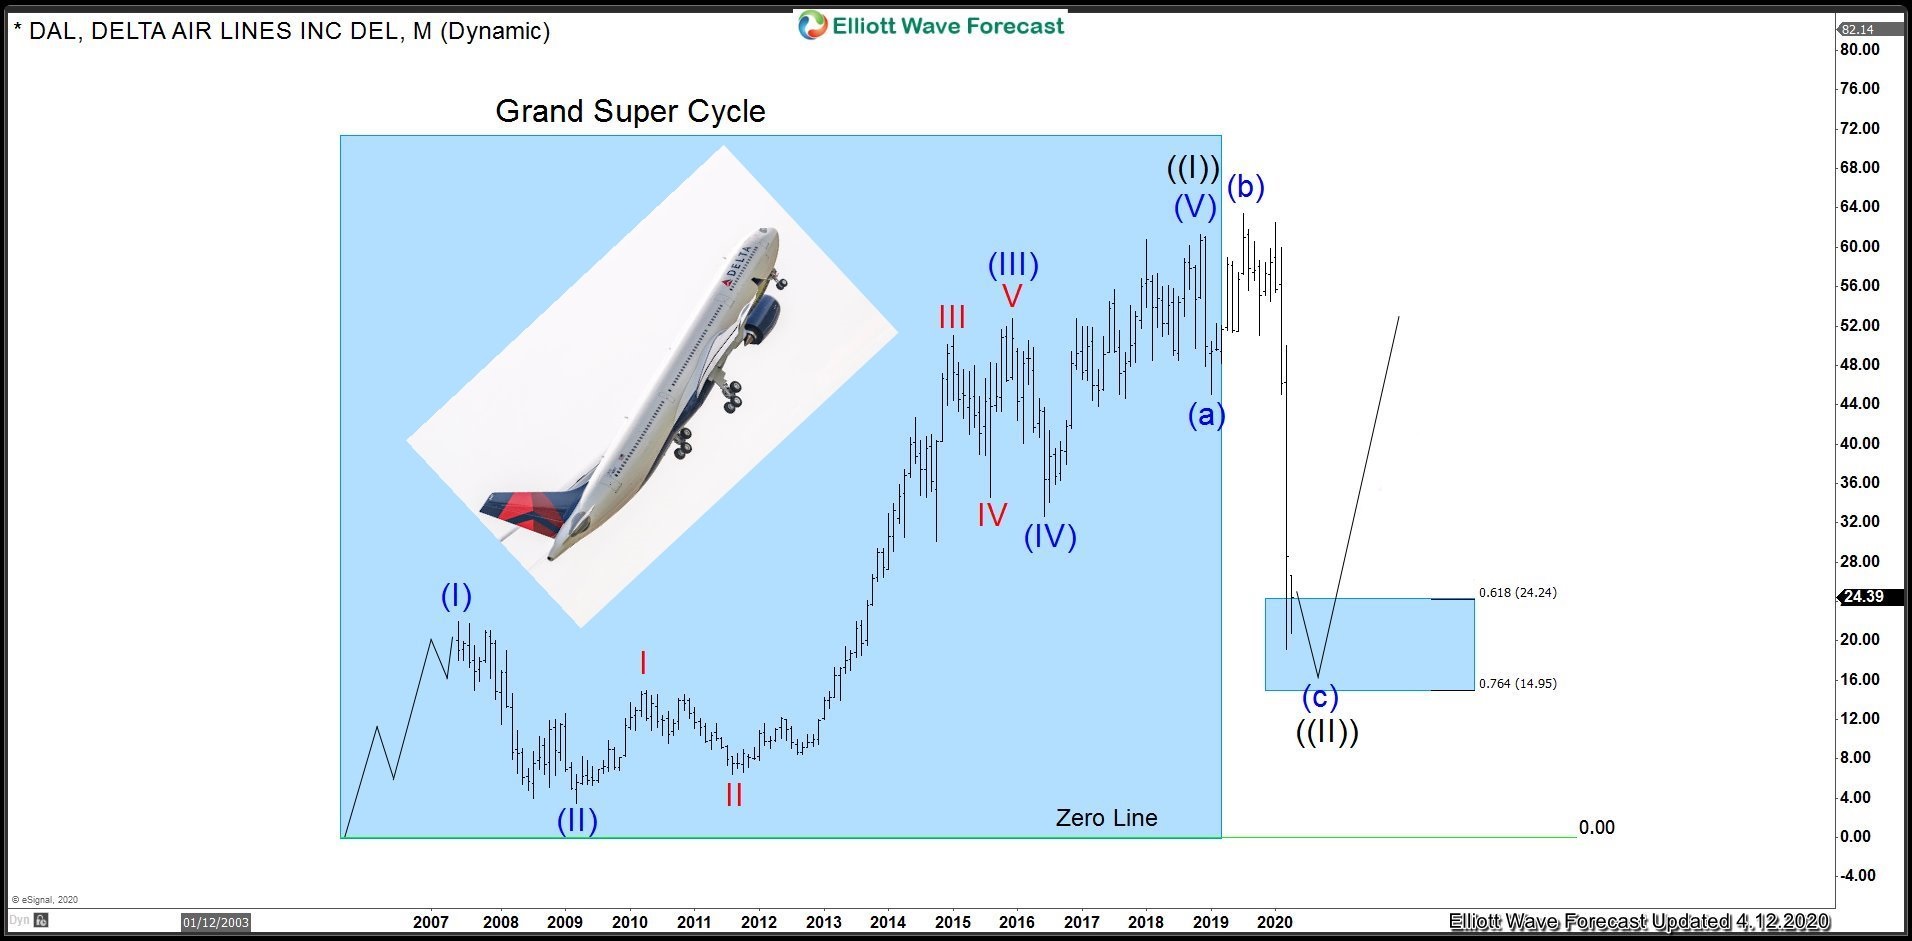
Chart below shows the Grand Super Cycle in Delta Airlines within which we are assuming that wave (I) ended at 21.95, wave (II) completed at 3.51 and this was followed by a rally in wave (III) which lasted over 6 years and completed at 52.77. Dip to 32.60 completed wave (IV) and rally to 61.32 completed wave (V) of the Grand Super Cycle wave ((I)). The sharp decline we saw February and March 2020 is thought to be part of a FLAT correction in wave ((II)) as it has already retraced more than 61.8% of the rally from the zero line, it is difficult to imagine this is just wave (a) of a larger zigzag correction. Moreover, if this is just wave (a) and it does a larger wave (b) bounce and then (c) leg lower, that would make some other Airlines and Cruise stocks run out of space to the downside so we are going with FLAT correction in wave (II) as the primary view.

DELTA AIRLINES (DAL) Elliott Wave Analysis – Daily Chart
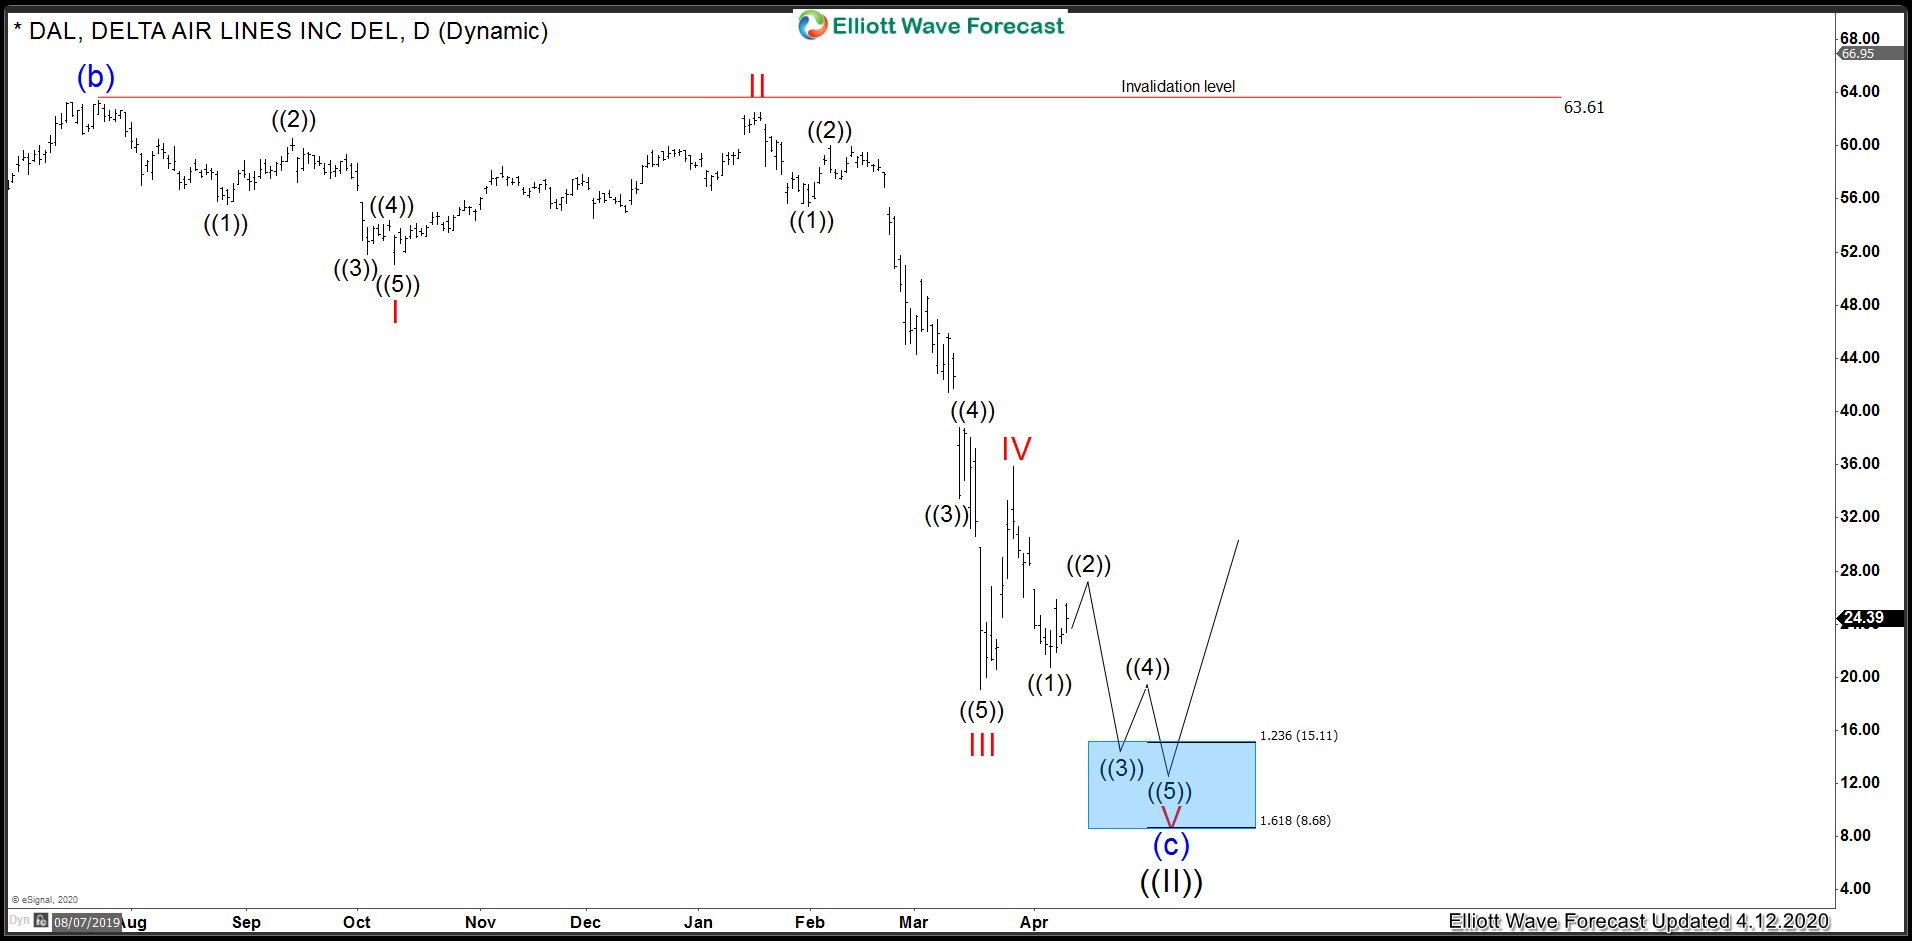
Chart below shows structure of the decline in proposed wave (c). We are calling wave I completed at 51.07, bounce to 62.48 completed wave II and decline to 19.10 completed wave III, sharp recovery to 35.89 was wave IV and now the stock has scope to make another low in wave V of (c) to complete the proposed FLAT correction or end just wave III of (a) as per the alternate view. Price should now stay below 35.89 peak for the view below to remain valid. New low in wave V should ideally target 15.11 – 8.68 area. As we are already at 61.8 Fibonacci retracement of the grand super cycle rally from the zero line, we don’t like chasing weakness here and think the stock is already in an area where long term investors would start getting interested for rally to resume for a new all time or a larger 3 waves bounce at least.

