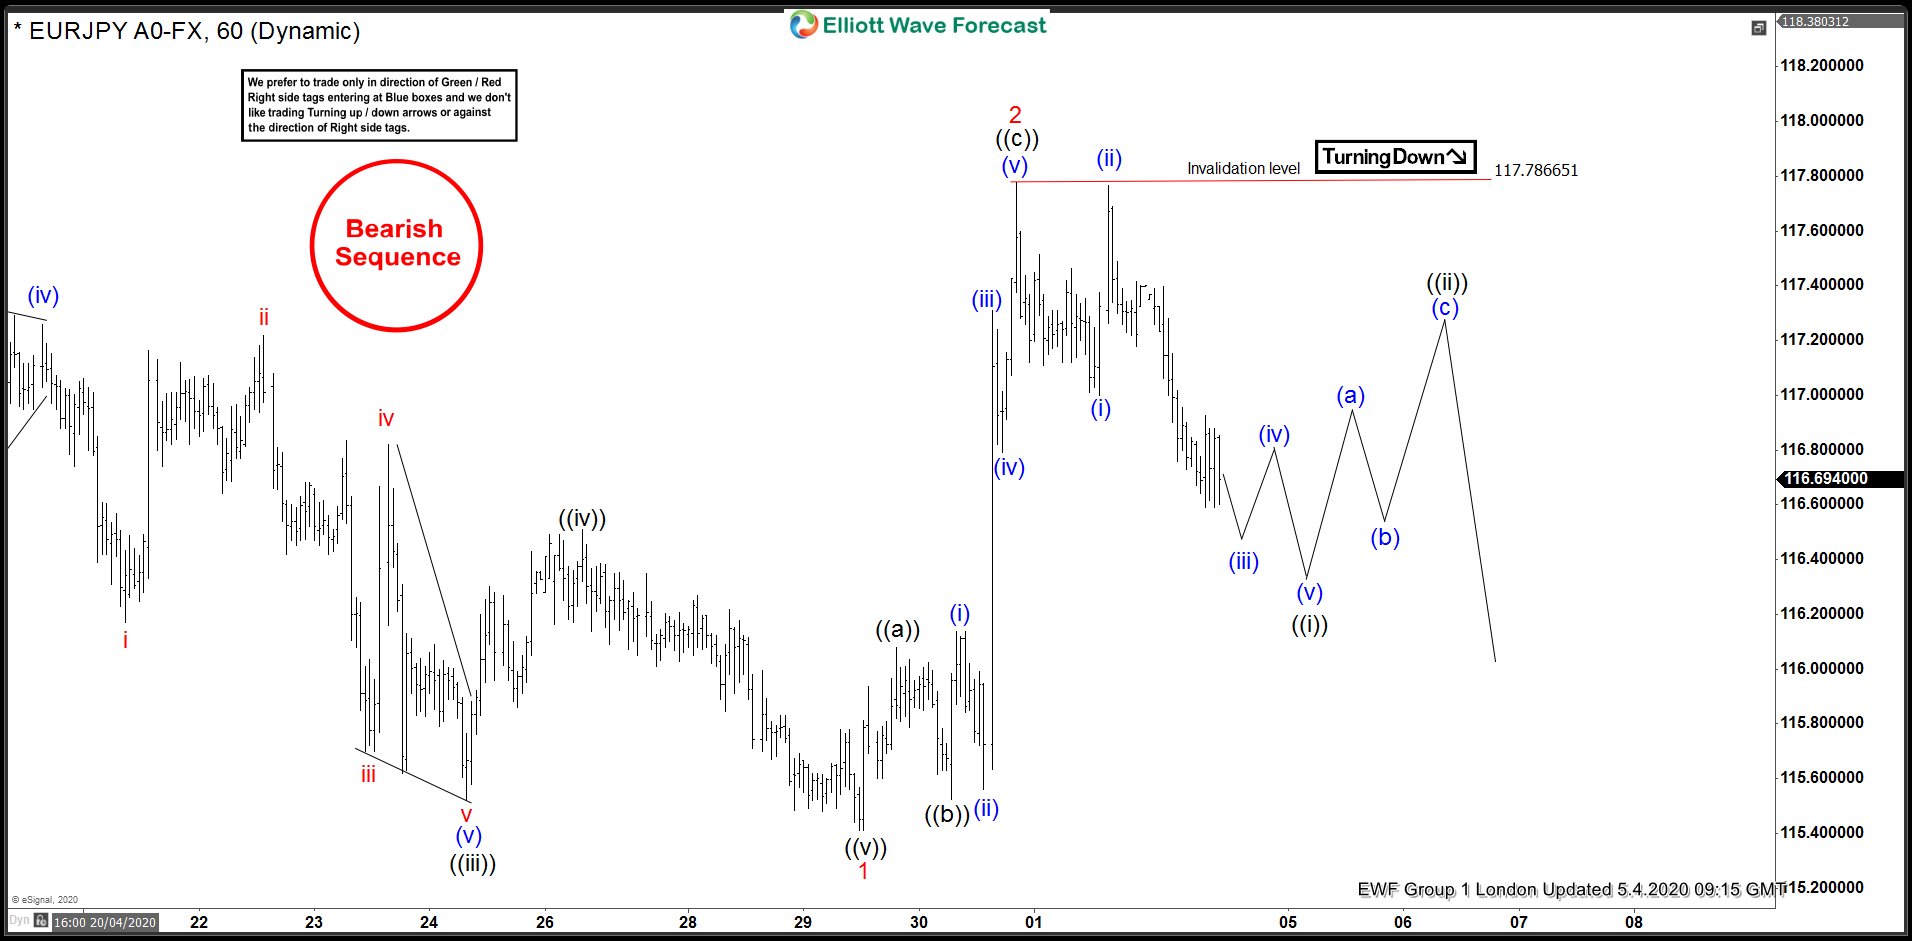
In this blog, we are going to take a look at the Elliott Wave chart of EURJPY. The chart from 4 May London update shows that the pair ended the cycle from 29 April low at 117.78 high. Wave ((a)) ended at 116.07 high. Wave ((b)) pullback ended at 115.52 low. From there, the pair extended higher and ended wave ((c)) at 117.78 high. The pair then turned lower from that high. While below 117.78 high, the bounce in 3,7 or 11 swing is expected to fail. However, EURJPY needs to break below previous wave 1 low to confirm that the next leg lower has started and to avoid doing a double correction in wave 2.
EURJPY 5.4.2020 1 Hour London Elliott Wave Update

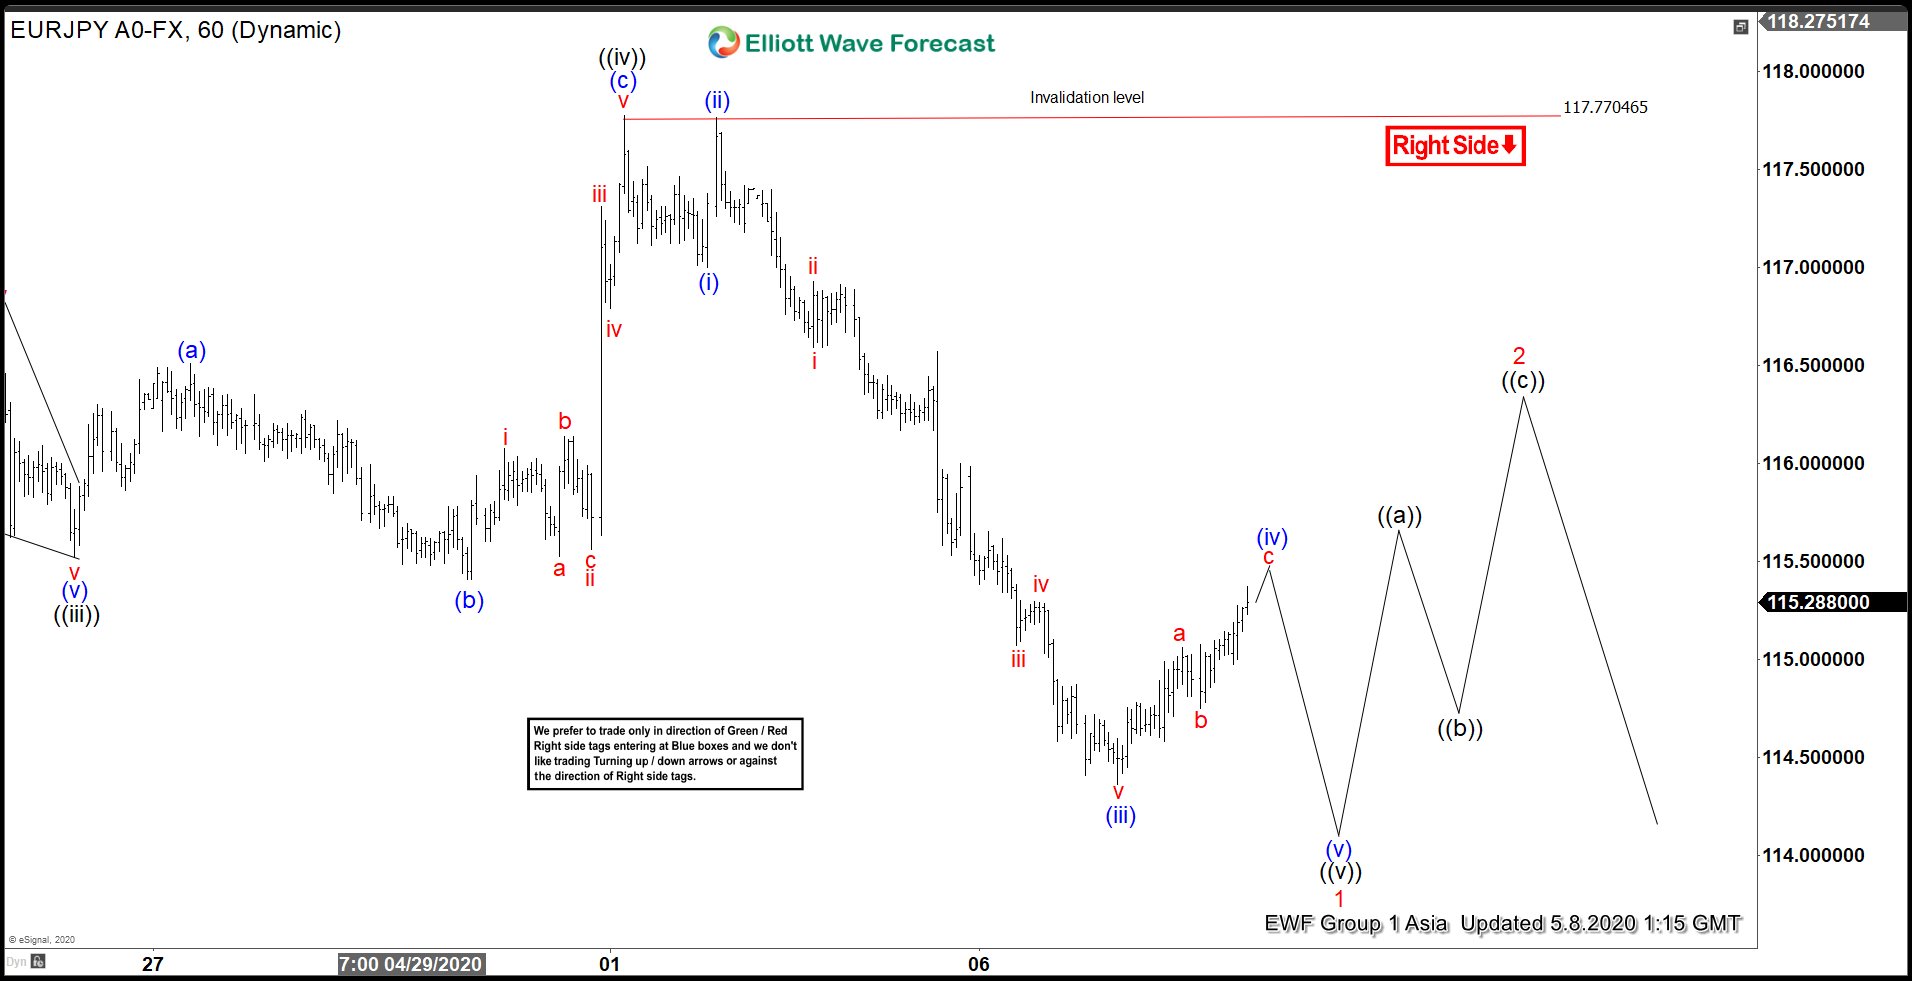
The chart below from 8 May Asia update shows that the pair continue to extend lower from 117.77 high. The pair also broke below the previous low. Wave (i) ended at 117.00 low and the bounce in wave (ii) ended at 117.76 high. The pair then continued to the downside and ended wave (iii) at 114.36 low. Wave (iv) is currently in progress. The pair can continue to the downside again later for another leg lower to end the 5 waves decline before it can do 3 waves bounce.
EURJPY 5.8.2020 1 Hour Asia Elliott Wave Update

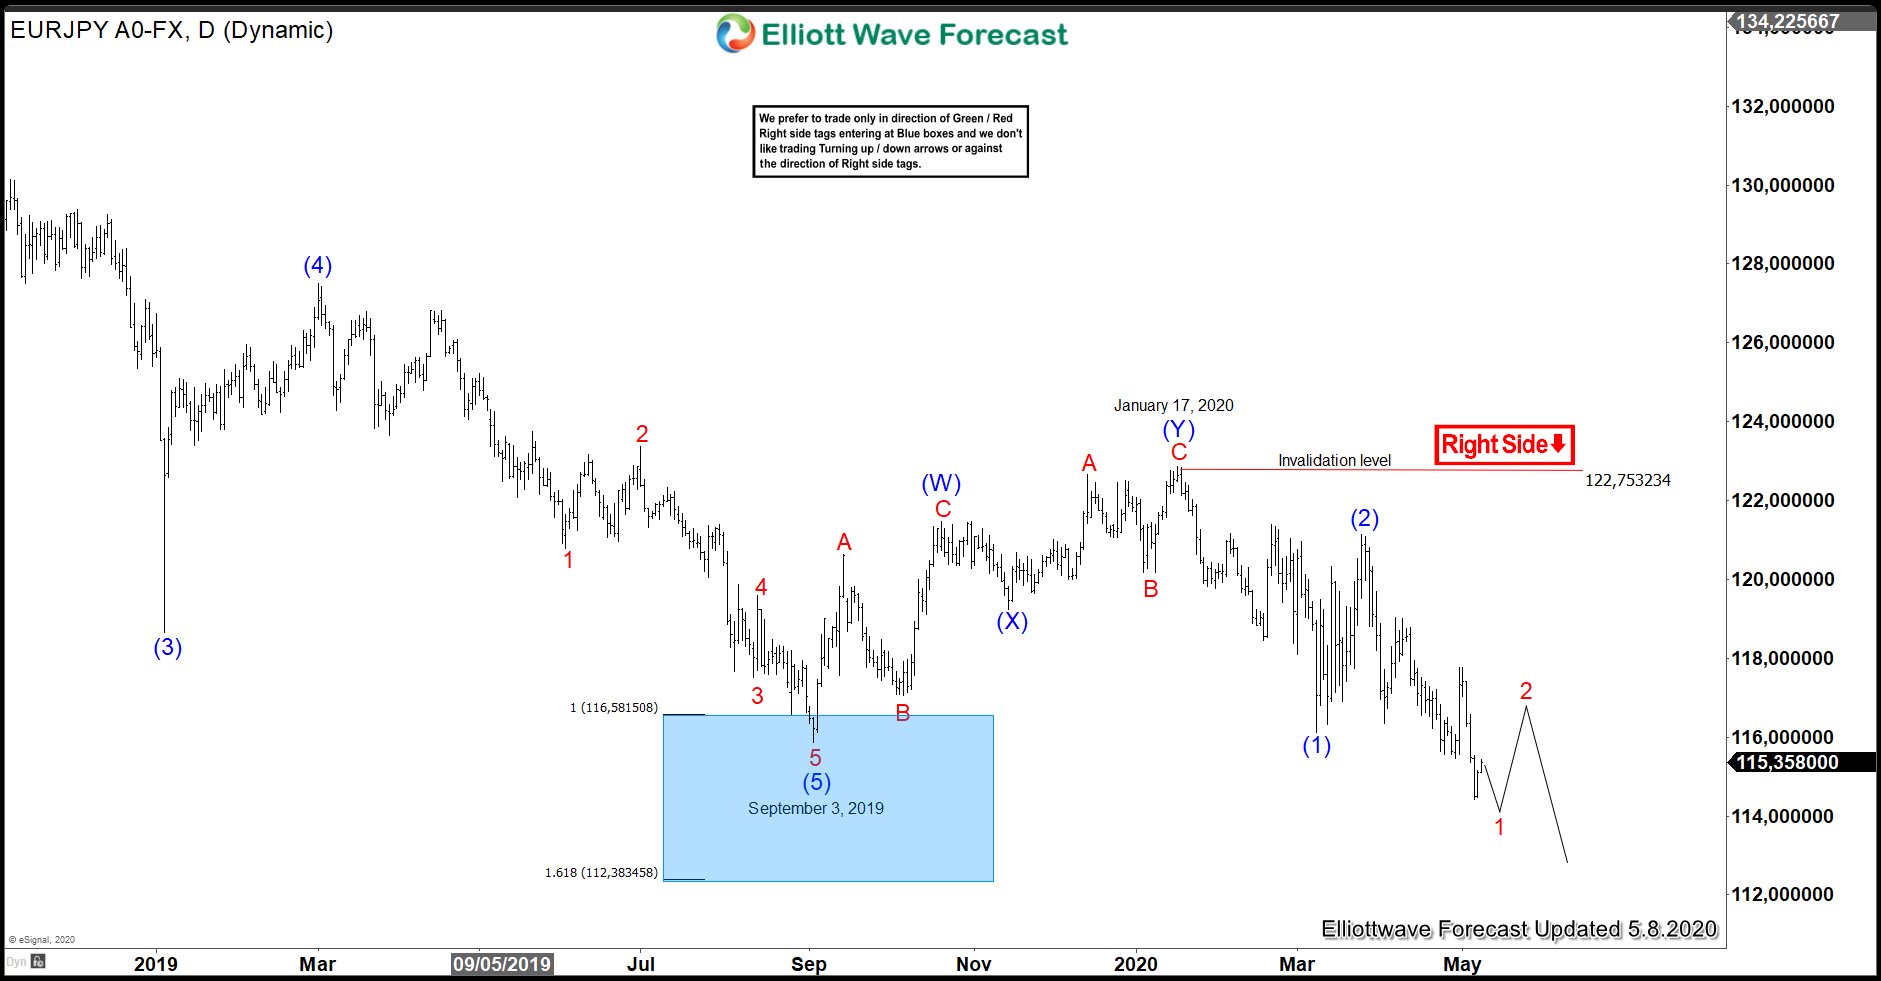
EURJPY daily chart below shows that the pair broke below wave (1) low. The decline has almost reached 100% -161.8% fibonacci extension of wave (1) – (2) between 110.10-114.30 area. However, the pair also broke below September 3, 2019 low, creating bearish sequence against January 17, 2020 high. The equal leg area where the decline can potentially end is at 101.10 level. As long as the high at 122.75 stays intact, the pair is favored for more downside.
EURJPY 5.8.2020 1 Hour Asia Elliott Wave Update


