SAP SE is a multinational corporation which is well known as a producer of the enterprise software being used in managing business operations and customer relations. Founded in 1972 and headquartered in Walldorf, Germany, the company’s most famous product is the enterprise resource planning (ERP) software. The company is a part of both DAX30 and of SX5E indices. In recent weeks, SAP contributes also actively in the fight against COVID-19 by developing of the contact tracing software. However, will that acttivity help the stock price to recover from the recent fall?
SAP Monthly Elliott Wave Analysis 05.18.2020
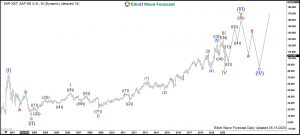
The monthly chart below shows the SAP stock $SAP traded at XETRA. From the all-time lows, the stock price has developed its first significant push higher in wave (I) of super cycle degree. This impulsive move up has printed a top in September 2000 at 77.50. From the peak, the wave (II) has provided a consolidation of the stock price in 3 waves lower as a zigzag correction towards the October 2002 lows at 9.92. So now, that level became the starting point of a larger move to the upside. The rally higher is the wave (III) of the super cycle degree. As a matter of fact, it reveals a clearly visible Elliott wave impulsive wave structure. Now, it is the preferred view that the wave (III) remains still in progress.
Within the super cycle in wave (III), the red wave I has ended in April 2006 at 47.68, the red wave II lower has found a bottom in October 2008 at 20.76. From that level on, the wave III has provided an extension higher towards the all-time highs in February 2020.

SAP Weekly Elliott Wave Analysis 05.18.2020 and Outlook
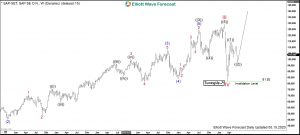
The weekly chart below shows in more detail the subdivisions of the extended wave III of (III). Wave III has peaked in February 2020 at 129.60. From there, a sharp decline in wave IV has delivered the march low at 81.92. While above there, the price can be now turning up in wave V of (III). In short-term cycles, wave ((1)) of primary degree is currently being corrected lower in the wave ((2)). The pullback should hold above 81.92. Then, SAP stock price should see waves ((3)), ((4)) and ((5)) of V to end the cycle from 2002 lows.
The target area for the termination point of wave V will be 140.30-158.65. This projection area originates from the inverse Fibonacci relationship of 1.23-1.618 between the lengths of the red waves IV and V. Alternatively, the stock price can do another swing higher and fall lower in a double correction. It can also do a sideways action in wave IV as a triangle. The preferred view remains that the prices will remain above the march lows. Therefore, buyers can enter the market in 3, 7, 11 swings for more upside towards 140.30-158.65 area or for at least another leg higher.


