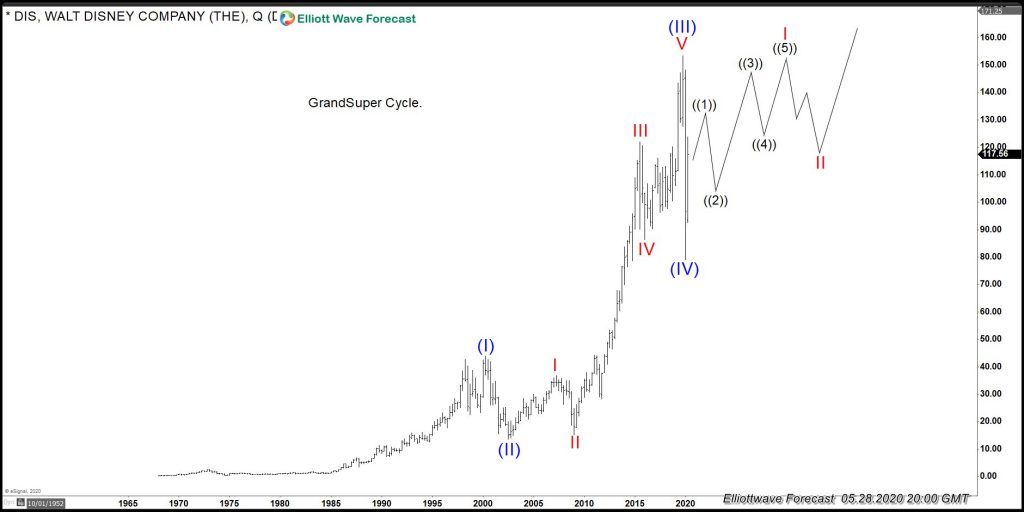
Like most stocks around the world. Walt Disney Company (ticker: DIS) took a dip earlier in the year. The decline was expected across the world markets at one point during 2020, but we believe the market has started to turn higher into new all-time highs. The Grand Super cycle is showing three waves advance as the chart below shows:
Walt Disney Company Quarterly Elliott Wave Chart

Looking at the chart, we can see the advance with a lot of extension between (I) Blue and (III) Blue. An Impulse is a structure which comes with three advances in the direction of the main trend. In Walt Disney Case, the advances are to the upside. Impulse should also have two cycles against the main trend. At this moment, we believe a move into all-time highs will happen sooner or later. Wave (IV) Blue might have already ended and a new and final cycle into a multiyear advance already started. This makes the next pullback a very interesting opportunity.
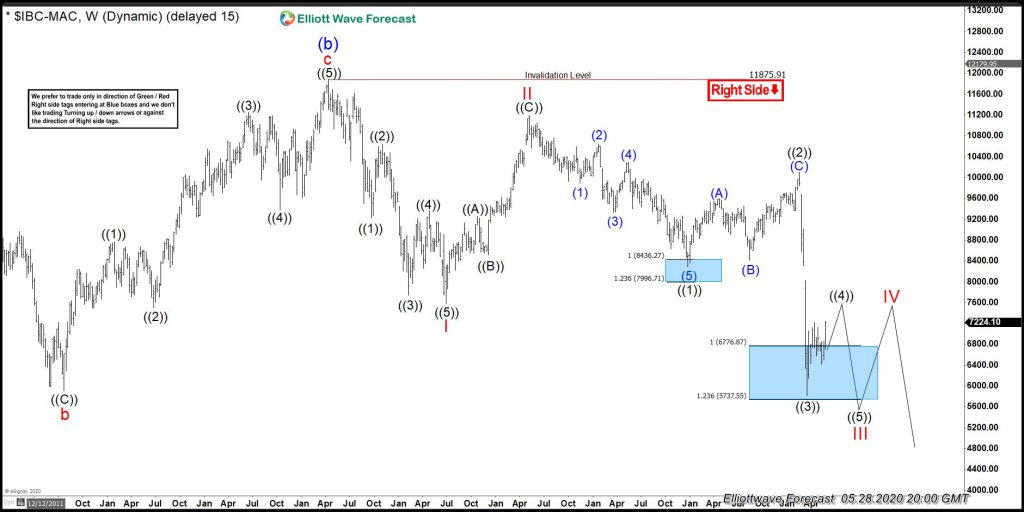
In general, we believe the stock market is not ready for acceleration yet. The reason is because instruments like $IBEX 35 and $IBM still show incomplete sequence to the downside. Below is the weekly Elliott Wave chart of IBEX showing the incomplete sequence from 2007 high:
IBEX Weekly Elliott Wave Chart

Above chart is the $IBEX35 weekly chart which requires at least two more cycles lower in the form of IV and V before a turn higher. This idea will make most of the instrument sideways. We believe $IBEX35 will make a new low at the time $DIS makes a pullback in wave ((2)). Another pullback in DIS can happen at the end of the year when $IBEX35 makes the last swing lower in wave V red.
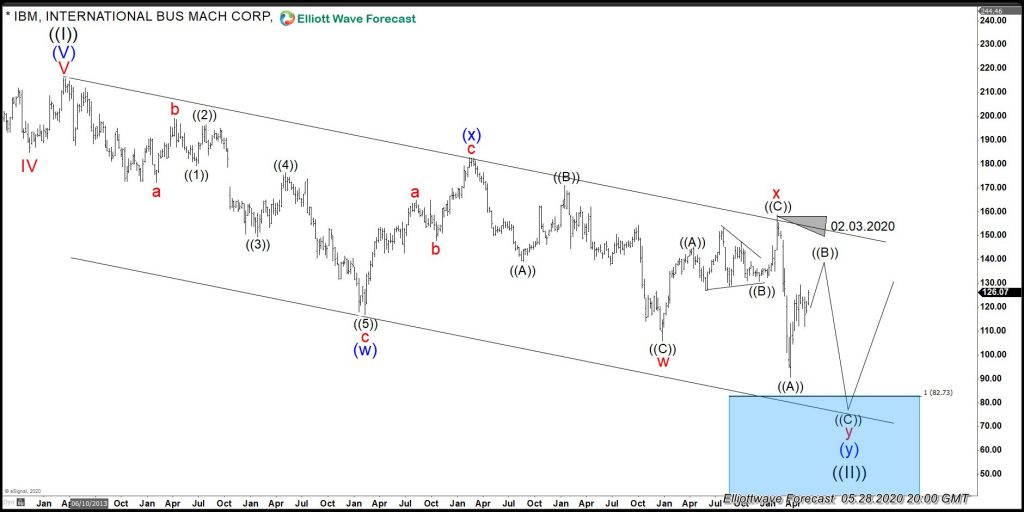
Another Interesting instrument is $IBM which also is showing a clear sequence lower and should soon reach the blue box buying area. Until then, the whole market will remain sideways to lower.

As far as IBM does not reach the blue box, $DIS will be trading sideways in a series of ((1)), ((2)) and then I and II. But when cycle in IBM ends at ((II)), the whole market including Disney will rally.
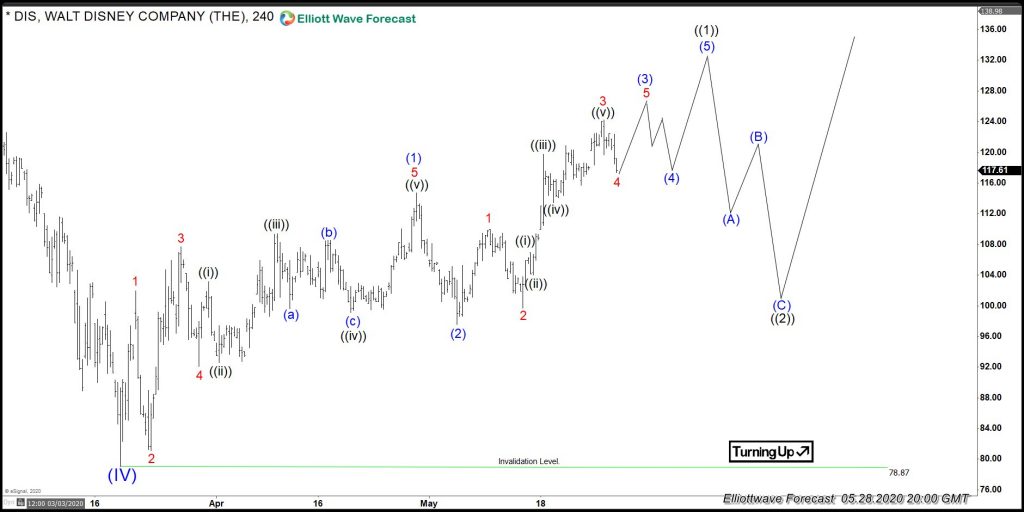
The reaction from the lows at 3.18.2020 so far looks like 3 waves. However, looking at other markets, we should see more upside and possibly create an impulse off the lows. Here is the 4 Hour chart of $DIS showing the idea and proposed path.

As we always do at EWF, we look at the market as a whole. Some instruments still can trade below the 03.2020 low, but some others will not trade below ever again. Combining everything together will provide a very nice opportunity.

