$TLT Elliott Wave & Longer Term Cycles
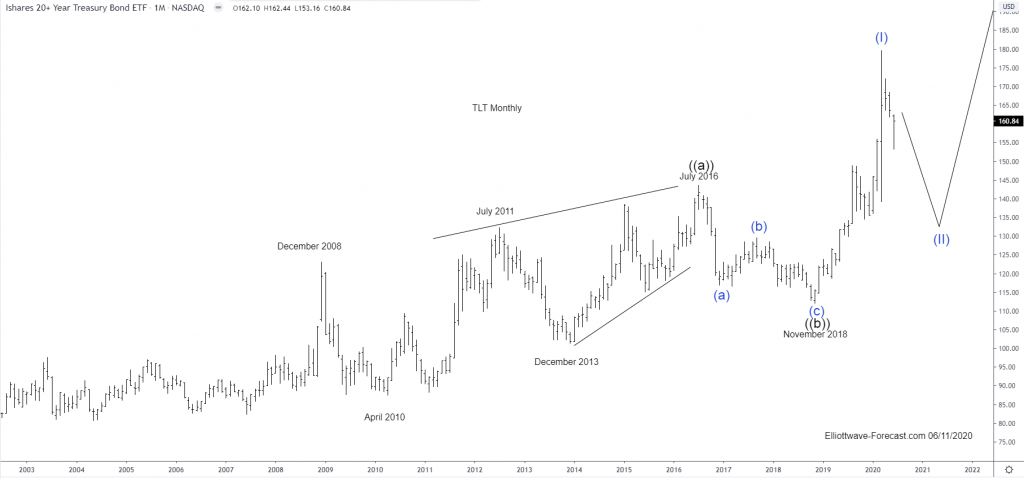
Firstly the ETF fund TLT inception date was on July 22, 2002. This instrument seeks to track the investment results of an index composed of or in U.S. Treasury bonds with maturities twenty years or more remaining. There is a lack of data before July 22, 2002. This is established. This article will focus on the larger uptrend cycle from there which is presumed finished a cycle higher from those lows in wave ((a)) in July 2016. The pullback from that high appeared to be an Elliott wave zig zag structure in three waves into the November 2018 wave ((b)) lows.
The analysis continues below the monthly chart.

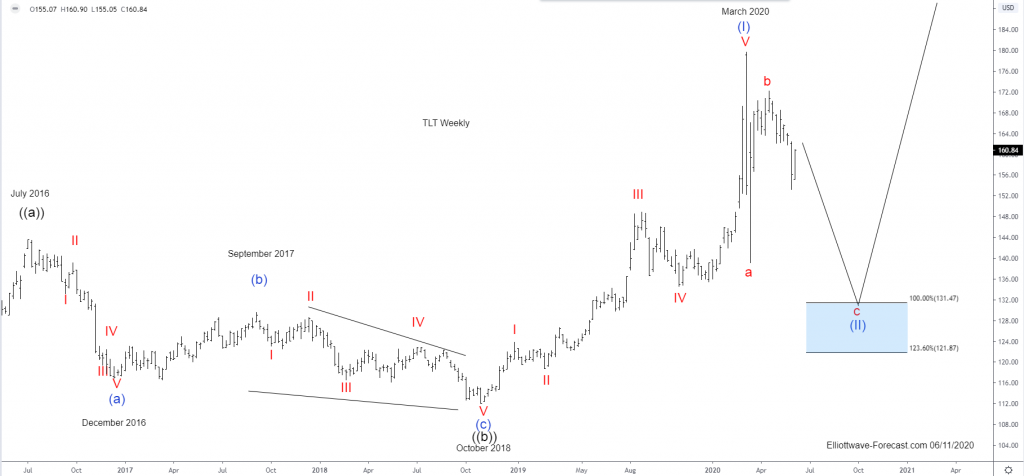
Secondly: The aforementioned pullback lower in the monthly chart wave ((b)) was strong enough to suggest it was correcting the cycle up from the all time lows. Thus it ended that cycle. From those November 2018 lows the instrument has made another high above the July 2016 highs creating a bullish sequence. This sequence higher from the November 2018 lows appears to be incomplete. On the weekly chart shown below, Elliott wave corrective sequences are in either three, seven or eleven swings. Impulses are in either five, nine or thirteen swings. It is obvious the three swings lower from the July 2016 highs into the October 2018 lows were of three swings.
The analysis continues and concludes below the weekly chart.

Thirdly and in conclusion the cycle up from the October 2018 lows appears to be an impulse that is incomplete. The cycle up from there ended at the March 2020 highs. Down from there a cycle in “a” completed as well as a wave “b” in April 2020. While below there it can see the 131.47 area to correct the cycle up from the October 2018 lows before a turn back higher.

