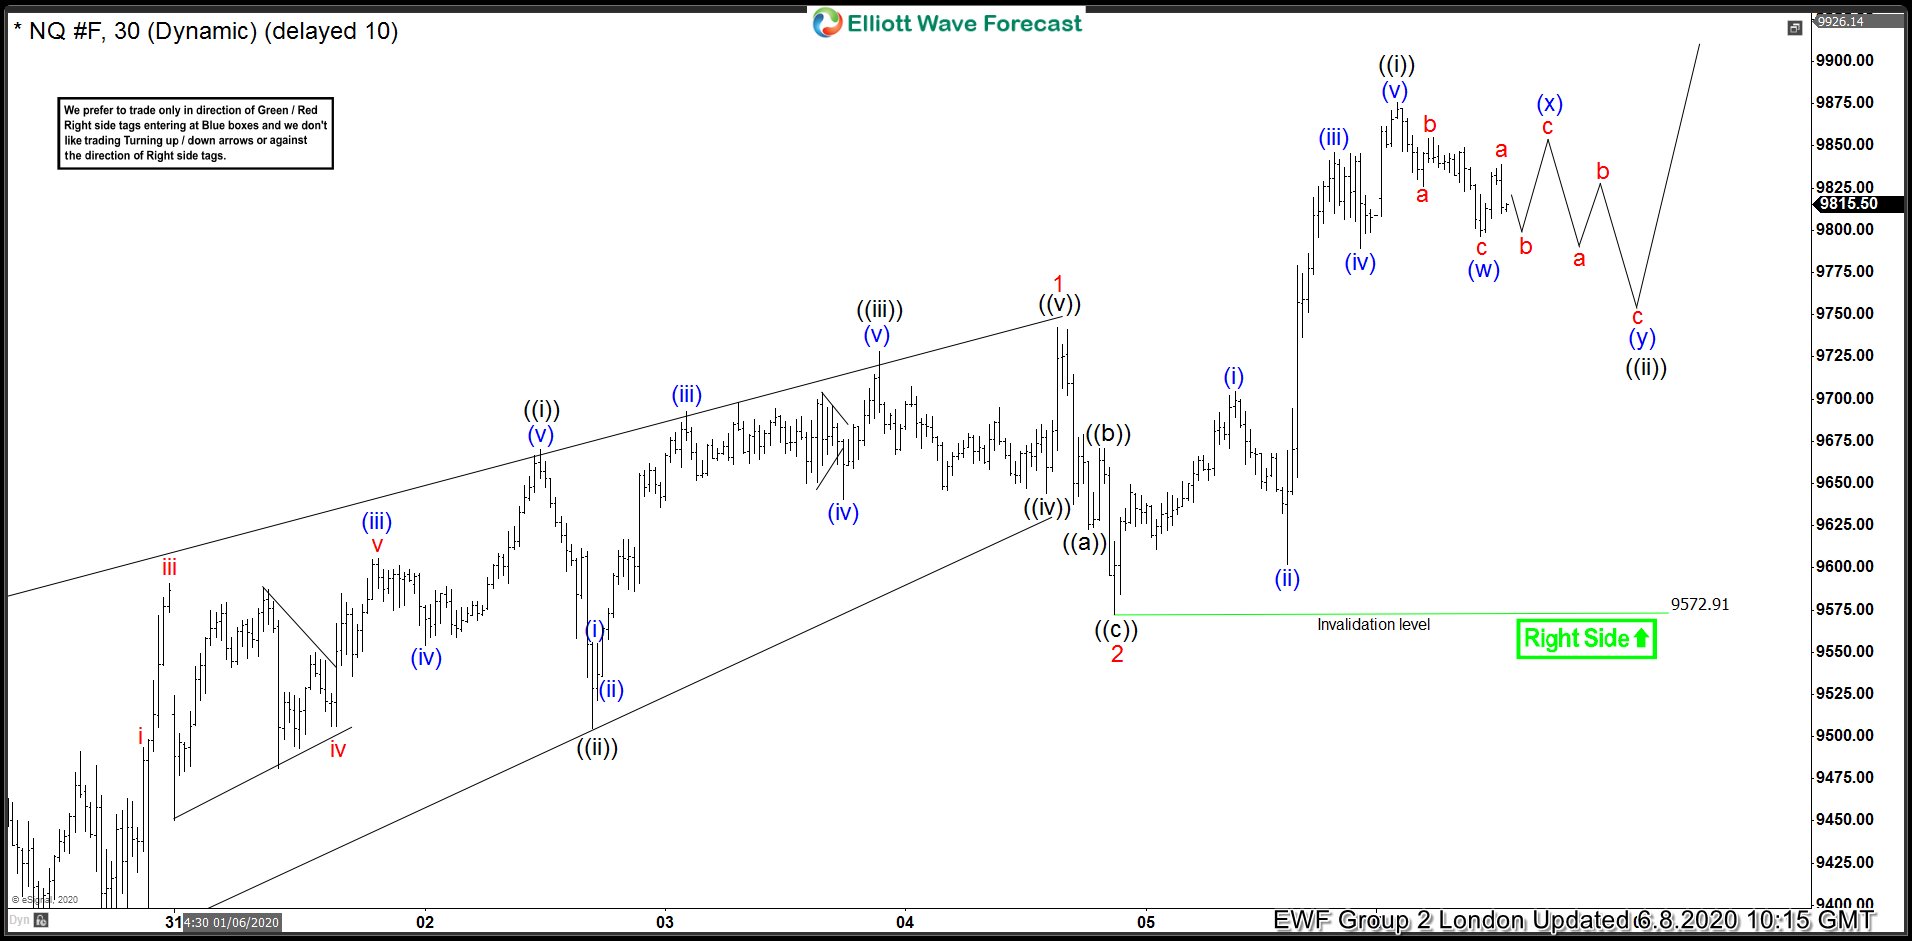
In this blog, we are going to take a look at the Elliott Wave chart of NASDAQ Futures (NQ_F). The 1 hour London chart update from June 8, 2020 shows that the index has ended the cycle from May 27 low at 9742.50 high. NASDAQ then did a pullback to correct that cycle, which ended at 9572.91 low. From there, the index continued to extend higher. It has broken above the previous high, creating an incomplete sequence to the upside. Up from 9572.91 low, wave ((i)) ended at 9875.50 high. The subdivision of wave ((i)) unfolded as 5 waves impulse Elliott Wave structure. Therefore, 3 waves pullback is expected to unfold before the index resumes higher. While above 9572.94 low, the dip in 3,7 or 11 swing is expected to be supported.
NASDAQ Futures 8 June London Elliott Wave Update

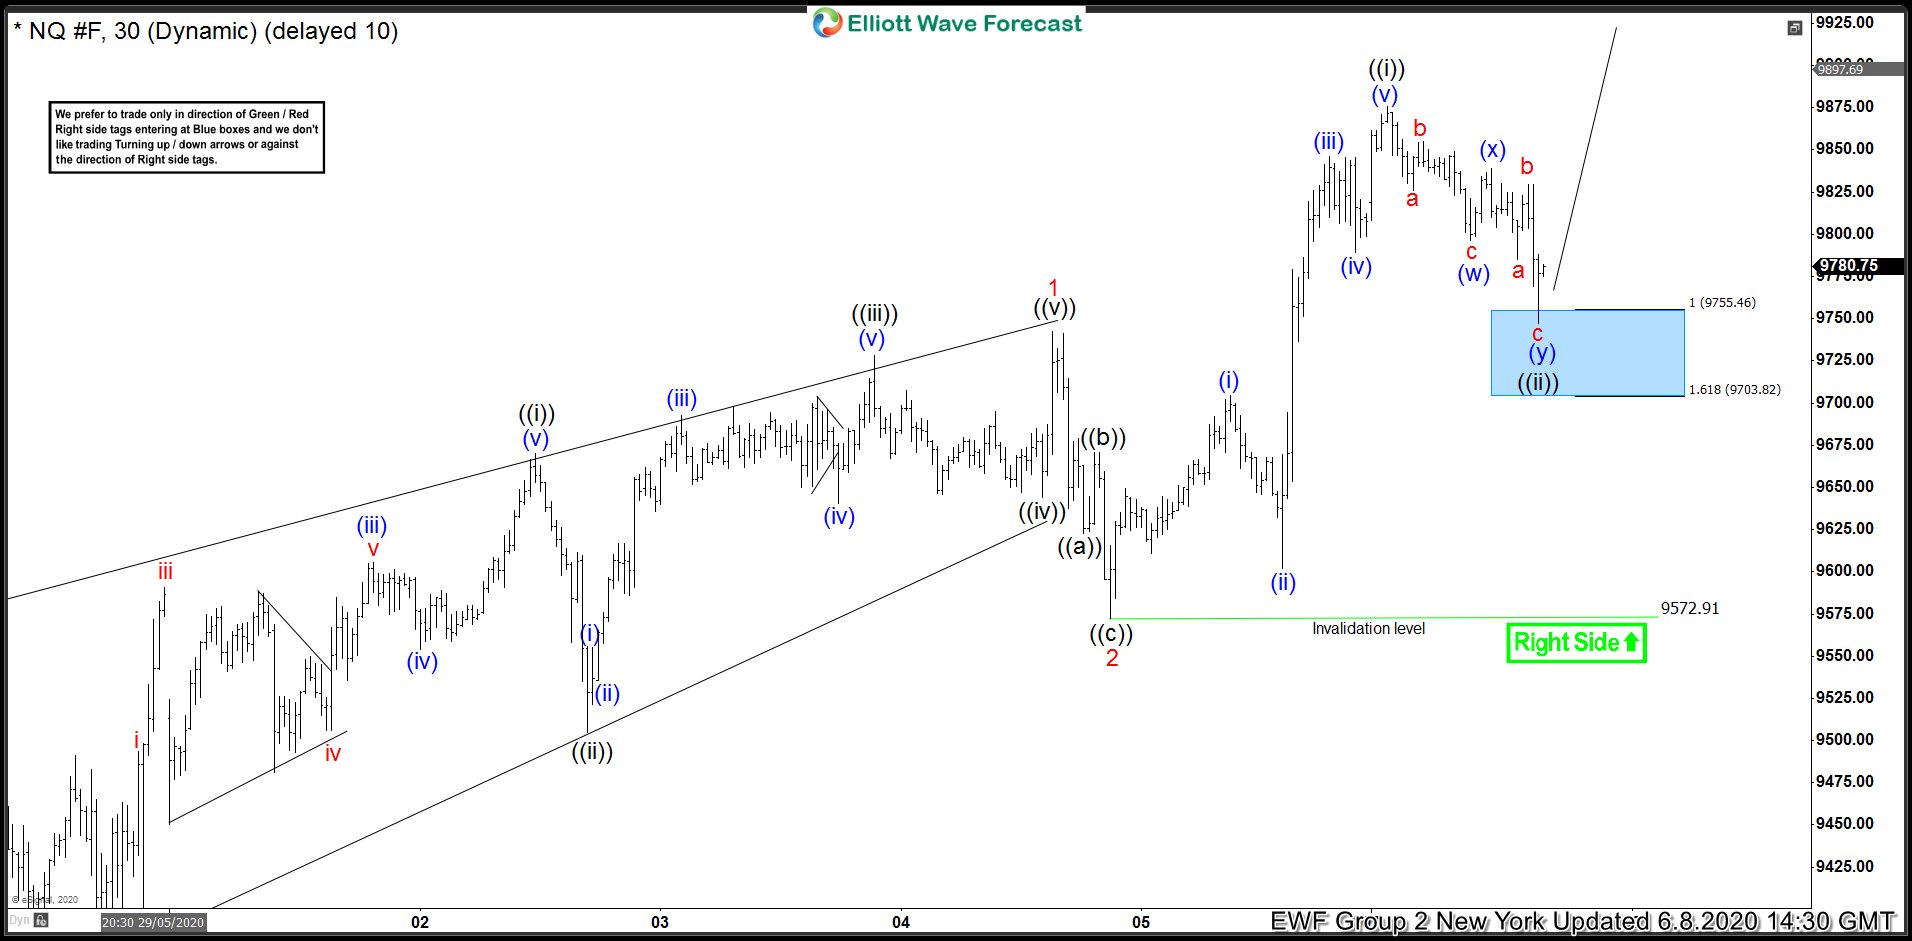
The 1 hour NY chart update from June 8 shows that the pullback in wave ((ii)) reached the equal leg blue box area of wave (w)-(x). This is an area where we expect buyers to appear for 3 waves bounce at least. In the Live Trading Room, EWF members managed to buy the dip in the blue box at the 100% extension level (9755.70) as shown in the Trading Journal below.

NASDAQ Futures 8 June NY Elliott Wave Update

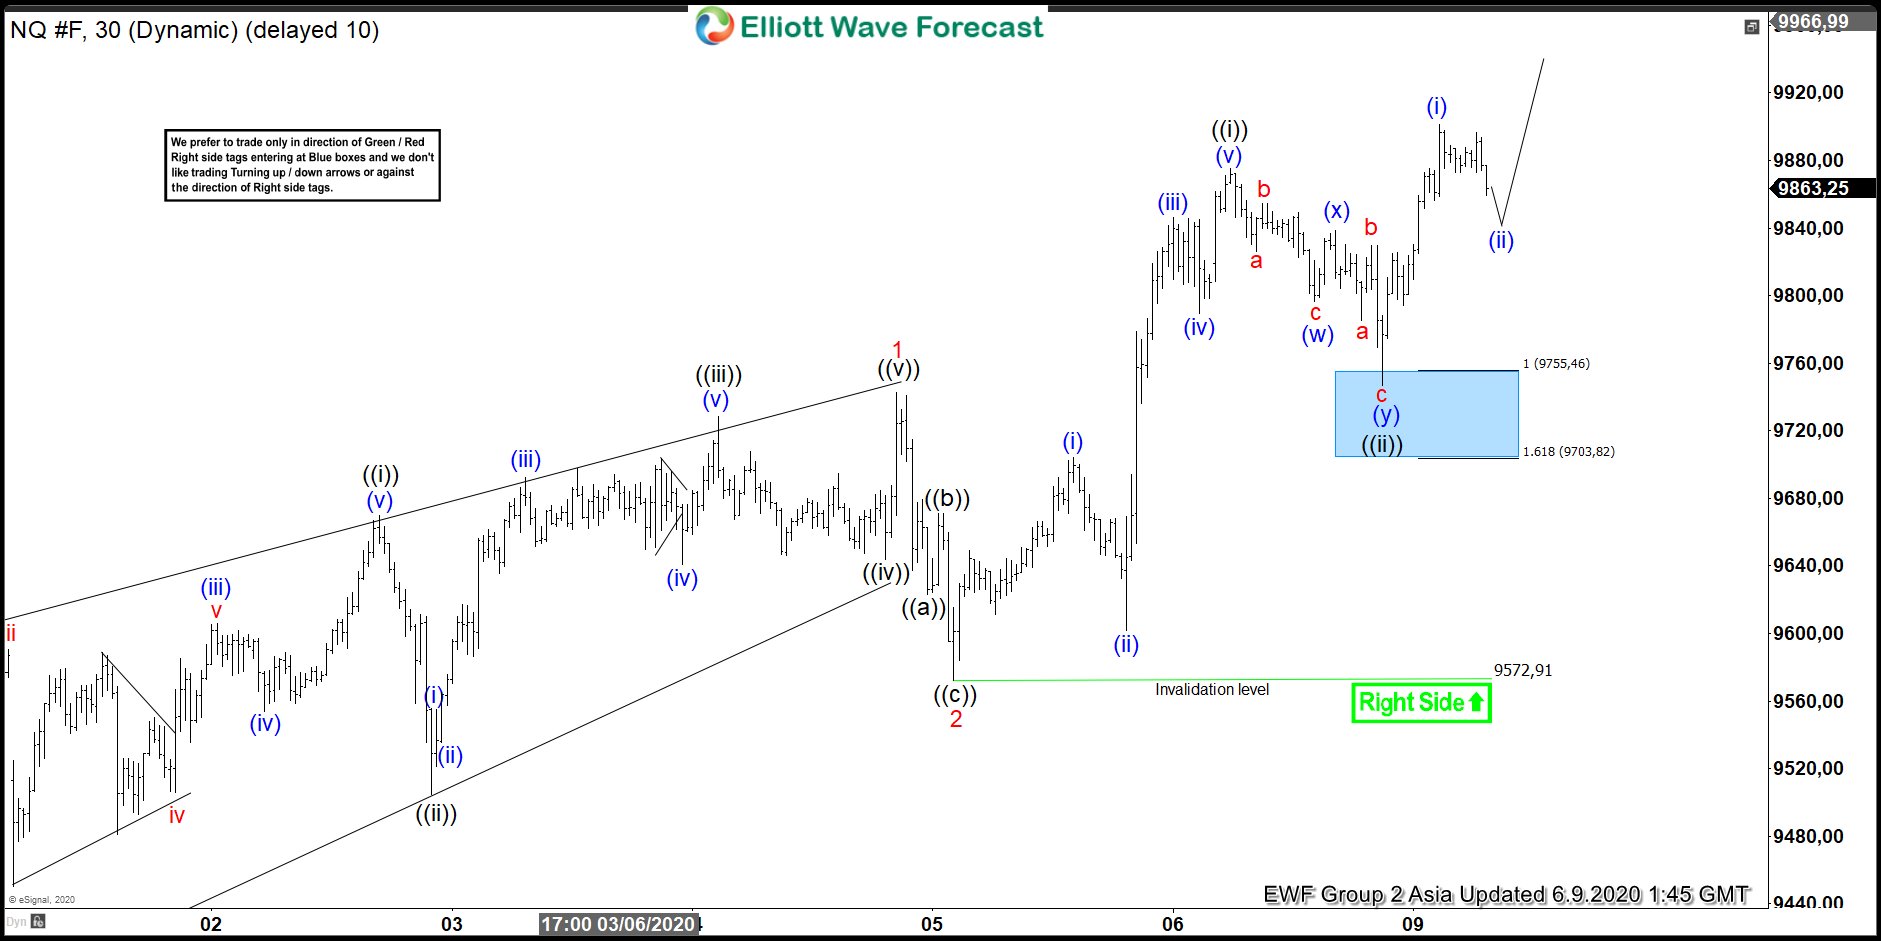
June 9 1-hour Asia chart update shows that buyers did appear at the blue box area. The index continued to extend higher from blue box and managed to break above the previous wave ((i)) high. This allows any long position from that blue box to be risk free as stop loss is moved to entry level.
NASDAQ Futures 9 June Asia Elliott Wave Update

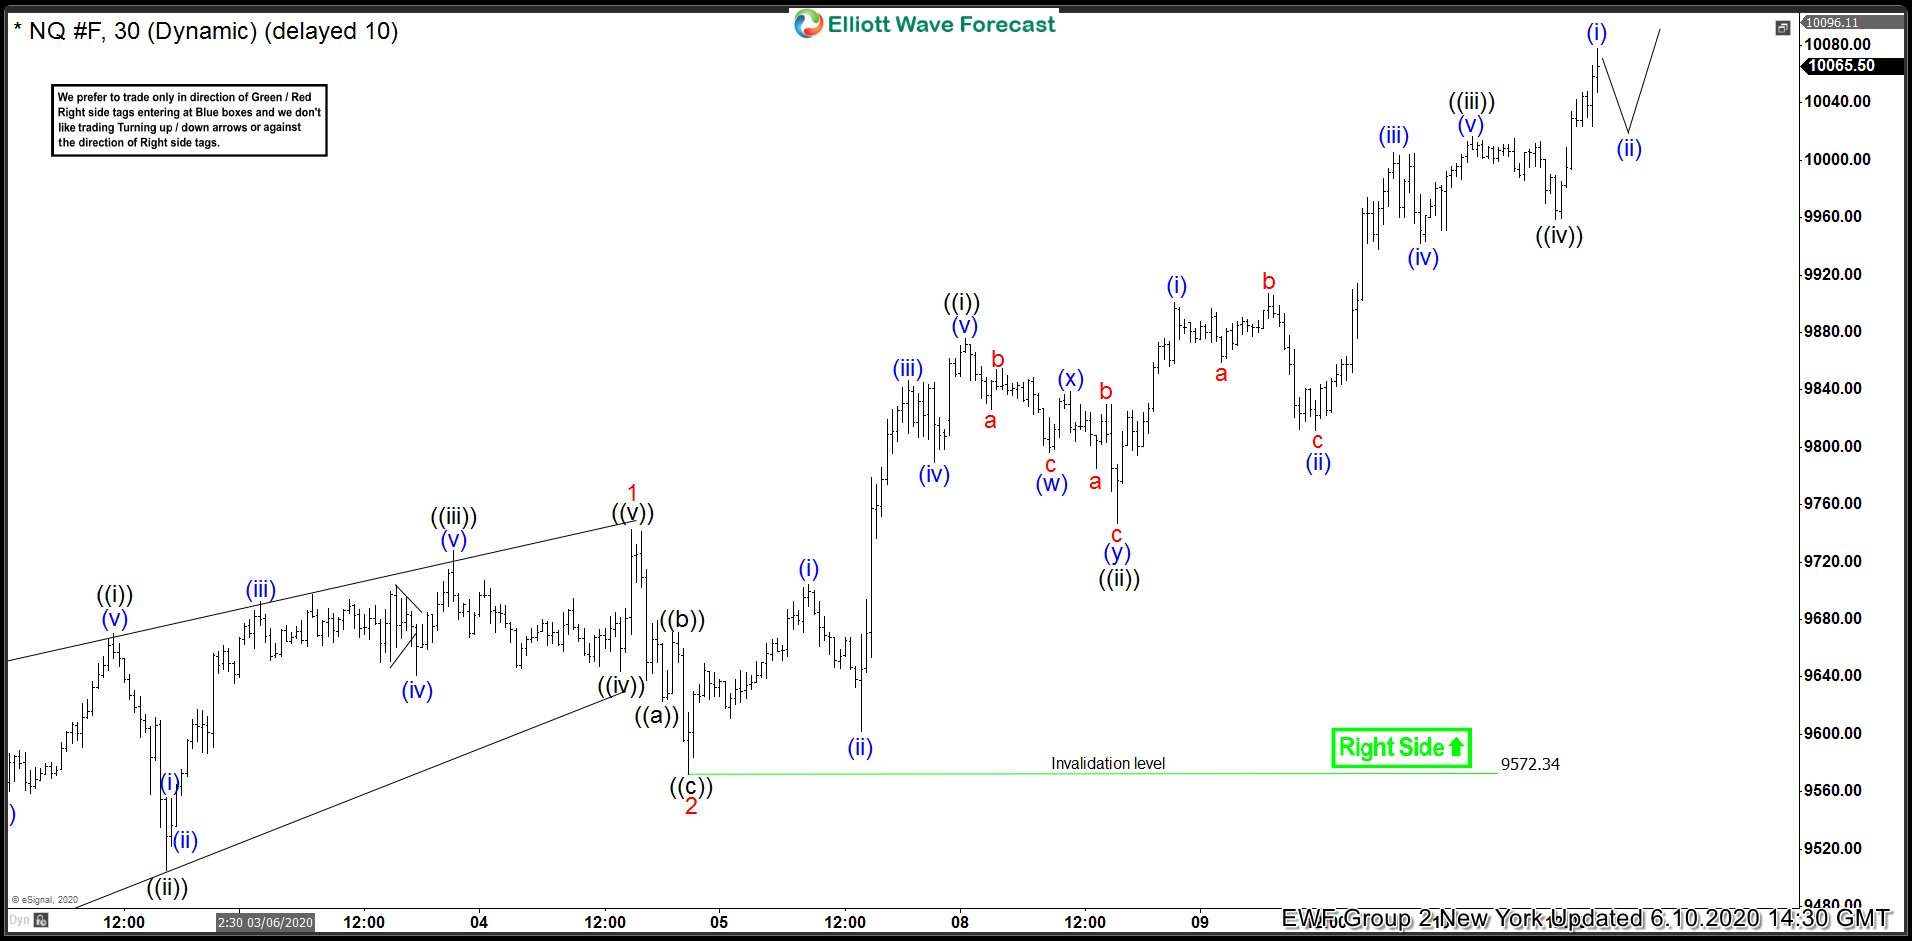
The 1 hour NY chart update from June 10 shows that the index continued to resume higher and made all-time high, breaking the previous February high. Members who took the long position from the blue box then managed to close the position at 10050 target for reward to risk ratio of 4.7.
NASDAQ Futures 10 June NY Elliott Wave Update

