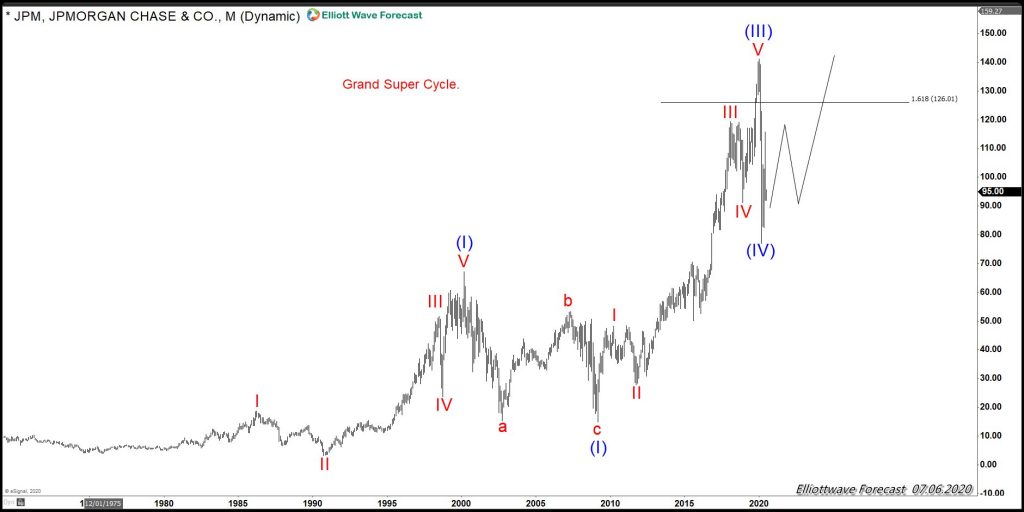
JPM Chase & Corporation, as many World Indices is showing an incomplete impulse since the all-time lows. The Instrument is showing a Grand Super Cycle propose impulse which is showing a wave (I) ending at 2000 peak. Then a nine years correction into 2009 lows and an amazing reaction higher since until this year peak. If we count the swings since the all-time lows it comes at this moment with an eleven swing count, and currently in swing twelve.
An impulse sequence comes as 5-9-13-17, which makes the upside still more likely to happen. One of the main differences between an impulse and a corrective advance is the separation between the waves, which we always identify, as per our new rules. Like if the relationship between (I) and (II) passes the 1.618 extensions, then most likely a wave (V) will be ending happening. The advance in JPM Chase is supporting the idea, because, as we can see went above the 126.00 area, which is the 1.618% extension.
JPM Elliott Wave Monthly Chart

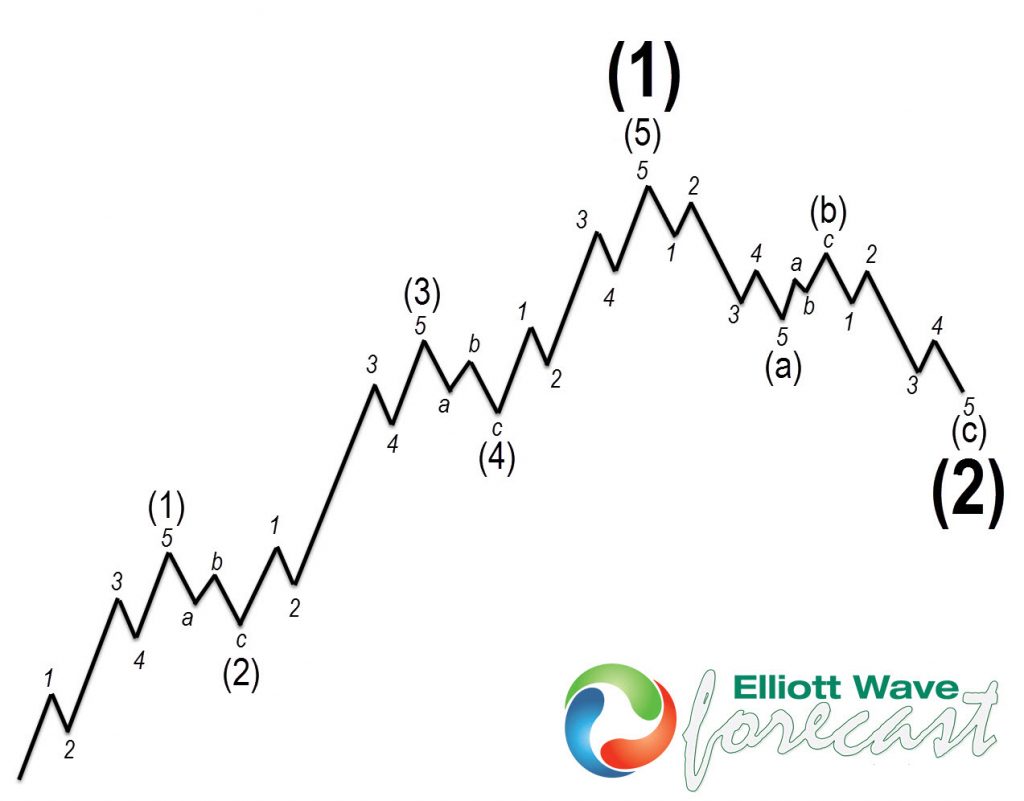
The following chart is showing an impulse structure in the Elliott wave Theory, which at this stage looks very similar to the reaction in JPM Chase and we should be coming higher into the wave (V),

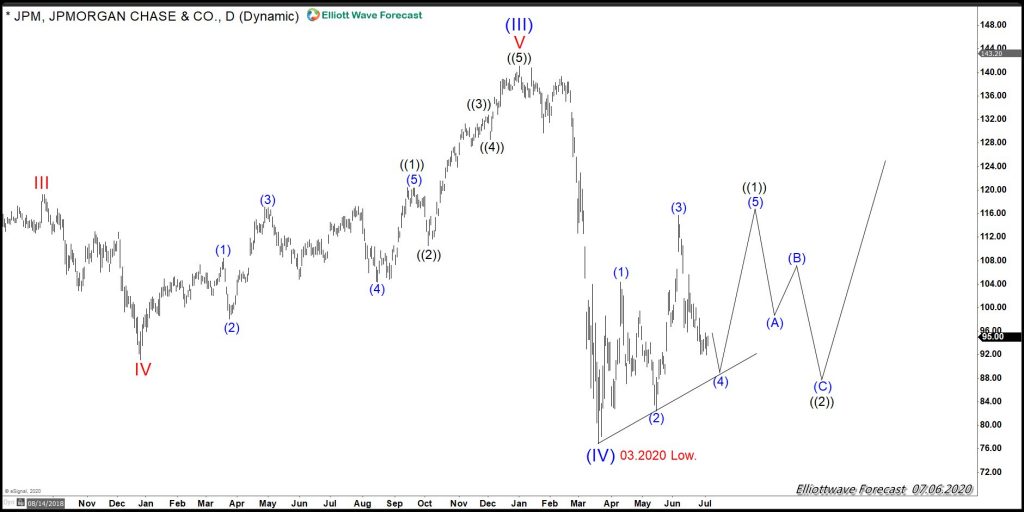
Since the lows at 03.2020, the recovery so far it is in three waves, which still is in what we call the twilight area because there is not a single winner. At this stage buyers need to wait for the peak presented as (3) to be broken, then buyers will gain control. And buying after three waves pullback will be a very good idea. The other definition will happen, if sellers will break the lows of wave (IV), and then buying at the 100% extension will also be a good idea.
JPM Elliott Wave Daily Chart


