The Bovespa Index Long Term Cycles and Bullish Trend
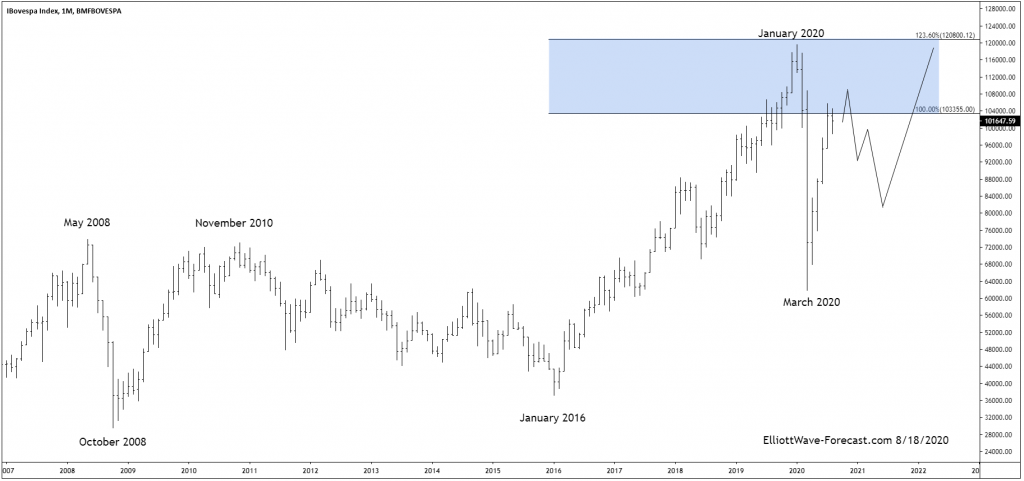
The Bovespa Index has been trending higher with other world indices. Since inception the cycles have shown a bullish trend. In early years not seen on this chart it rallied with other world indices trending higher into the May 2008 highs. It then corrected the whole bullish cycle from the beginning. That was while most other world indices were in a pullback lower. The index ended that larger degree correction in October 2008. At this point is where the index corrected the whole decades long bullish cycle. Thus the October 2008 lows is from where this bullish cycle and swing analysis will begin.
First from the October 2008 lows the index rose into the November 2010 highs in what appears as an impulse. From there the index endured an almost 6 year long correction of that cycle into the January 2016 lows. That pullback can be counted in Elliott Wave several different ways but is irrelevant because since has made new highs.
The analysis continues below the chart.

Secondly I want mention the blue box area that was reached in the cycle up into the January 2020 highs. This is Fibonacci extension measured from zero up to the May 2008 highs then back down to the October 2008 lows. This is a typical place for the next cycle higher in any degree to reach as it did in January 2020.
Thirdly and in conclusion. The pullback into the March 2020 lows was enough to suggest it was correcting the cycle from the 2008 lows. This was shared by other world indices and some have already made new yearly highs in their bullish cycles. This one should be no different and eventually will get back above the January 2020 highs. From the March 2020 lows the index appears to be an impulse when looked at in the lower time frames. The index should see another high in the 108000-109000 area at a minimum before it corrects the cycle up from the March 2020 lows. This is pretty much in line with other world indices. There should be a bullish outcome in the index while above the March 2020 lows.

