The Micex Index Long Term Cycles and Bullish Trend
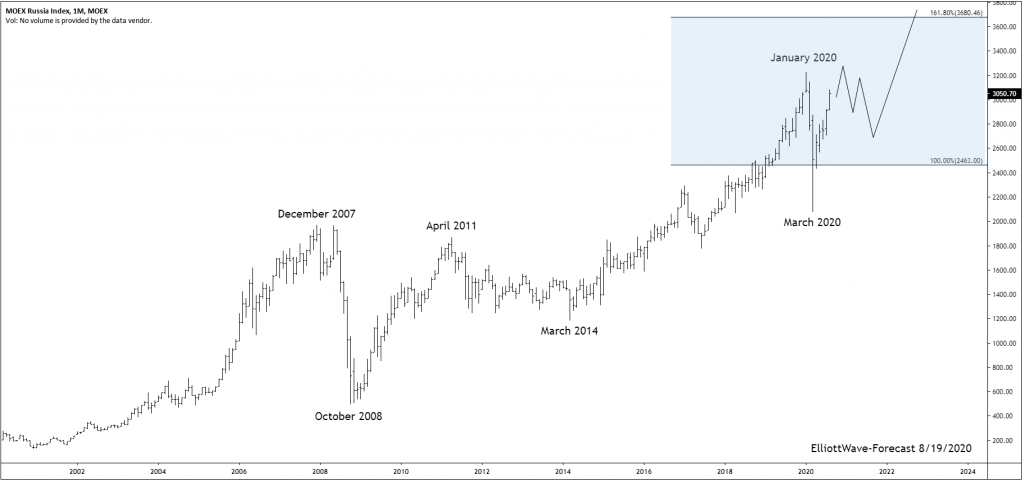
The Micex index has trended higher with other world indices since inception. The index remained in a long term bullish trend cycle into the December 2007 highs. It made a sharp correction lower in 2008 that lasted until October 2008 similar to other world indices. That is where the index corrected the whole decades long bullish cycle.
Firstly from the October 2008 lows the index rose into the April 2011 highs. Then the index saw an almost 3 year long correction of that cycle into the March 2014 lows. That pullback corrected the whole cycle up from the 2008 lows. From there to the January 2020 highs reached the blue box highlighted Fibonacci extension area. This is a typical area where the second cycle with the tread reaches. This area was defined by measuring a Fibonacci extension from the beginning level zero up to the December 2007 high down to the October 2008 low.
The analysis continues below the chart.
Monthly Chart

Secondly I would like to mention this overall price movement in the bullish cycles leaves the index in a couple of different scenarios. One way to view it from an Elliott wave perspective is the January 2020 highs was the end of a larger degree third wave. I do not prefer this because it suggests after a few more new highs back above the January 2020 highs the index will suffer a huge correction bigger than ever seen before.
Thirdly in conclusion. The positive progression of mankind is reflected in equity indices. I do believe in the technical indicators that suggests I saw enough pain in the dips into the 2008 as well as the March 2020 lows that should eventually prove to be longer term cycle lows. I think the index has a longer term series of nested wave ones and twos. As suggested on the chart I think the cycle from the March 2020 lows should continue higher in the near term before a pullback corrects that cycle. I expect the index will remain above there for a long time progressing higher.

