KGHM Polska Miedź S.A. is a multinational corporation which has its headquarters in Lubin, Poland. Traded under tickers $KGH at WSE and $KGHPF in US in form of ADRs, it is a component of the WIG30 index. KGHM has been a major copper and silver producer for more than 50 years. As a matter of fact, it operates 9 underground and open-pit mines located in Poland, USA, Canada and Chile and is actively advancing other projects. KGHM produces key global resources including copper, silver, gold, platinum, nickel and others. Currently, we see metals like copper and silver turning higher after the years of depressed prices. As a rule, the rally in prices of metals provides a magnifying effect on the share prices of metals producing companies. Therefore, KGHM being one of major producers should become a profitable invetsment target as it should ramp up along with acceleration in commodities prices.
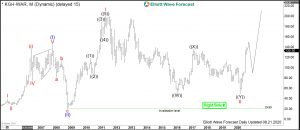
KGHM Monthly Elliott Wave Analysis 08.21.2020
The monthly chart below shows the KGHM shares $KGH traded at Warsaw Stock Exchange. First, from the all-time lows, the stock price has developed a cycle higher in wave (I). Hereby, KGHM has printed a top in October 2007 at 145. Since the red wave III of blue wave ((I)) shows a price separation higher, the cycle up is obviously an impulse. From the highs, a correction lower in wave (II) has unfolded as a zigzag correction being a 5-3-5 structure. It has found an important bottom in October 2008 at 20.10.
From the 2008 lows, another motive cycle has started. KGHM has broken the 2007 highs at 145 in a 5 waves move in the red wave I. Hereby, the share price has printed the all-time highs in April 2011 at 200.30. From the highs, a multi-year correction in wave II has started. Hereby, one can recognize a double three pattern. It has ended in March 2020 with a capitulation move down to 48.
From the March 2020 lows at 48, KGHM has started a new cycle higher in wave III of (III). It is favored to break to the new all-time highs. The target area for the wave III to end is towards 229.05-340.55. As of right now, first leg up can be seen. Alternatively to a proposed rally, expect after a pullback another leg higher at least.

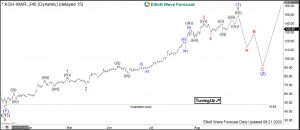
KGHM 4H Elliott Wave Analysis 08.21.2020
The 4H chart below shows in more detail the advance higher from the March lows at 48. The cycle up remains still intact and might be currently in the wave 5 of (1). Together with major indices, expect the march cycle to end soon. After a pullback in wave (2), another extension higher should take place.
In overall, monthly but also 4H view on $KGH shows a strong correlation to the copper prices. The march cycle is similar also to that in silver, copper and indices. All these instruments may be turning up and are expected to see more upside. Therefore, KGHM can be a smart investment for those who want take an advantage of rising prises in both stocks and commodities.

Get more insights about Stocks and ETFs by trying out our services 14 days . You’ll learn how to trade the market in the right side using the 3, 7 or 11 swings sequence. You will get access to our 78 instruments updated in 4 different time frames, Live Trading & Analysis Session done by our Expert Analysts every day, 24-hour chat room support and much more.

