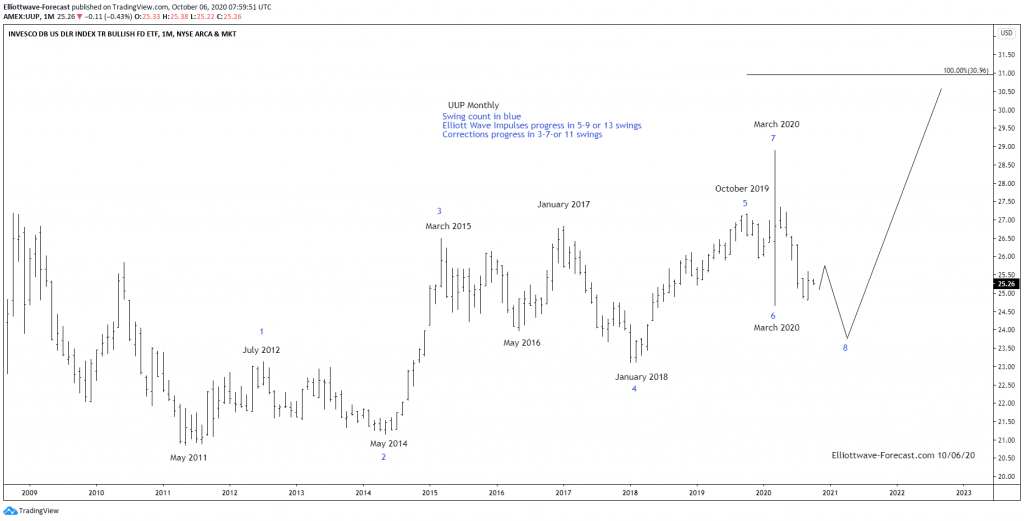
UUP Remains Bullish In Cycles from May 2011
Firstly the dollar tracking ETF fund UUP inception date was 2/20/2007. Interestingly the dollar index has a low in March 2008. The UUP ETF fund shows a low in May 2011. The dollar index did make a pullback cycle low in May 2011 however it was well above the March 2008 lows. The bullish cycle up from the May 2011 lows in UUP is the focus of this analysis where it begins on the monthly chart. It should see some further upside relatively soon before any more larger size downturns in the longer term cycles.
The analysis continues below the $UUP monthly chart.

Secondly the bullish cycle up from the May 2011 lows in UUP appears to be advancing higher with some overlap in the cycles. This is as per would any diagonal. However price has got above the January 2017 highs giving the dollar representative instrument a bullish sequence. From the May 2011 lows the dollar instrument appears to have at least 4 swings in place to the January 2018 lows. From there according to the momentum indicators used here it ended a cycle up at the October 2019 highs in a 5th swing. The pullback into the March 9 2020 lows was the 6th swing. It was strong enough to suggest it was correcting the cycle up from the January 2018 lows.
Thirdly and in conclusion, the swing and Elliott Wave count suggests further upside in the dollar later. March 2020 has seen some fast 6th & 7th swings. The best reading of the cycles suggest after a near term bounce it will see another low under the March 2020 lows toward the 24.63 to 23.78 area. Afterward, it can see further strength higher trend for a couple of years in a 9th swing. This should carry the dollar instrument toward the 30.96 area before a significant turn back lower.

