Every trader that uses the Elliott Wave theory as part of their trading analysis knows that the strongest and longest of a impulse wave pattern is the wave 3. On October 8/2020 we at EWF advised our clients, in our members only area, that the AUDUSD pair was forming this impulse wave pattern.
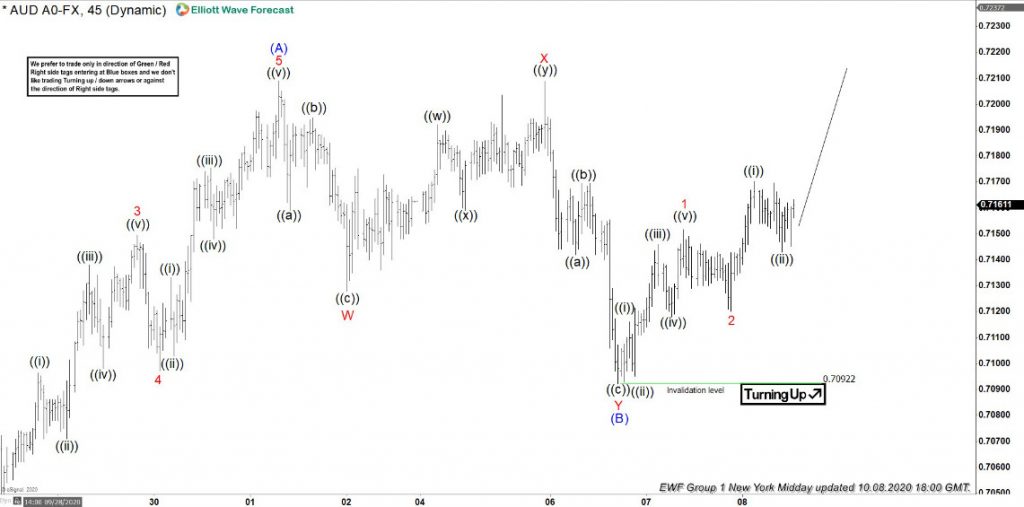
The chart below was posted in our members only area showing that we were calling for the impulse move higher and advising our clients that the wave 2 red terminated and the pair was getting ready to rally higher for a wave ((iii)) black of wave 3 red to complete the higher degree move of the wave (C) blue. Invalidation level was set at the start of the proposed impulse wave sequence. Only a break below the wave (B) blue would cancel the impulse move higher. When you understand Elliott Wave structures, traders could have placed tighter stops below the wave 2 red low for if price broke below this level it will show that the pair would not have enough momentum to rally higher.
AUDUSD 45 Minute Midday Update Chart October 8 2020

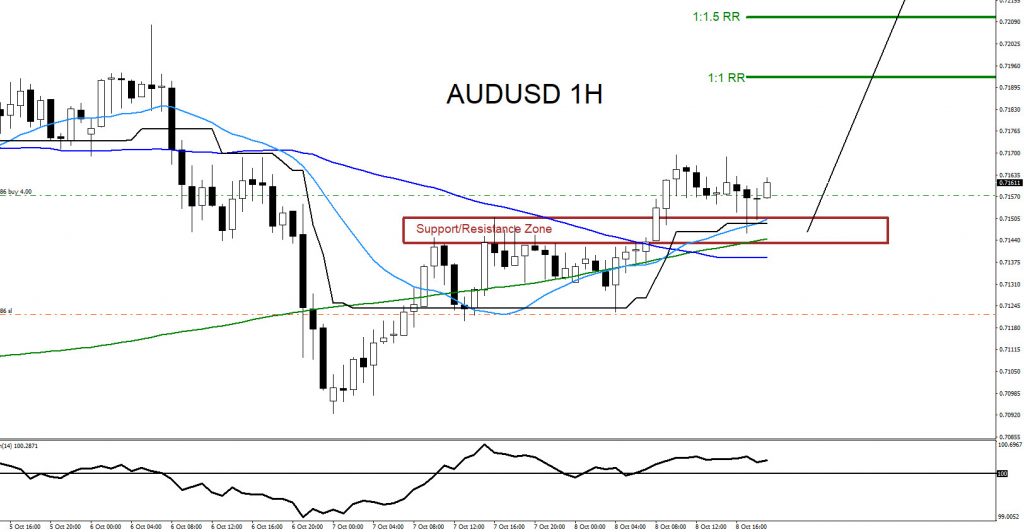
On October 8 2020 I posted on social media @AidanFX 2 BUY entry setups for the wave 3 rally higher. The 1st AUDUSD BUY entry (below) shows price was respecting the support/resistance zone (brown) and candlestick formations were producing shadows/wicks in this zone signalling that buyers were trying to push the pair higher. Trade was entered on the first signs of rejection of the zone and stop loss was set at the proposed wave 2 red low of the Elliott Wave structure.
AUDUSD 1 Hour Chart October 8 2020

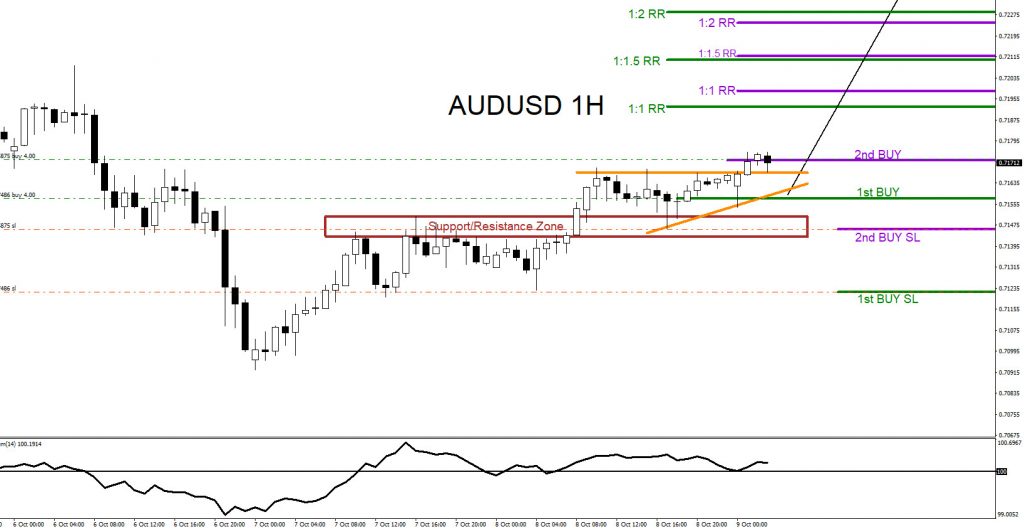
AUDUSD 2nd BUY entry (below) shows price moved higher from the support/resistance zone (brown) and formed a bullish ascending triangle breakout pattern (orange). Buy entry was triggered when price broke above the triangle pattern with stop loss at the black wave ((ii)) low of the proposed Elliott Wave structure.
AUDUSD 1 Hour Chart October 8 2020

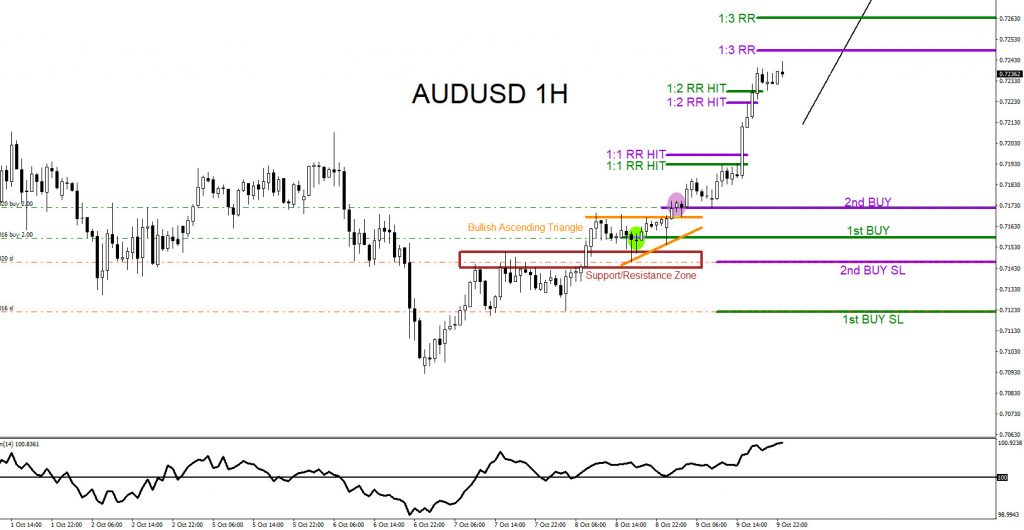
In the chart below, AUDUSD eventually rallied higher and hit the 1:2 RR BUY targets on both entries. The pair has strong momentum to the upside and we expect price to continue higher hitting more targets above. The Elliott Wave bullish impulse wave sequence is not complete and the recent wave 3 red move higher has not shown completion so we can still assume the market is still currently on the red wave 3 rally. Expect higher prices in the coming trading days. If you followed me on Twitter/Stocktwits @AidanFX you too could have caught the AUDUSD move higher.
AUDUSD 1 Hour Chart October 9 2020

Of course, like any strategy/technique, there will be times when the strategy/technique fails so proper money/risk management should always be used on every trade. Hope you enjoyed this article and follow me on Twitter for updates and questions> @AidanFX

