Nifty ended an impulse advance from September 24 low to October 15 high and started pulling back. The pull back was corrective so we expected it to end the correction and resume the rally for a new high in wave ((5)) extension or produce a bounce in 3 waves at least. Let’s look at the recent charts to see how it unfolded.
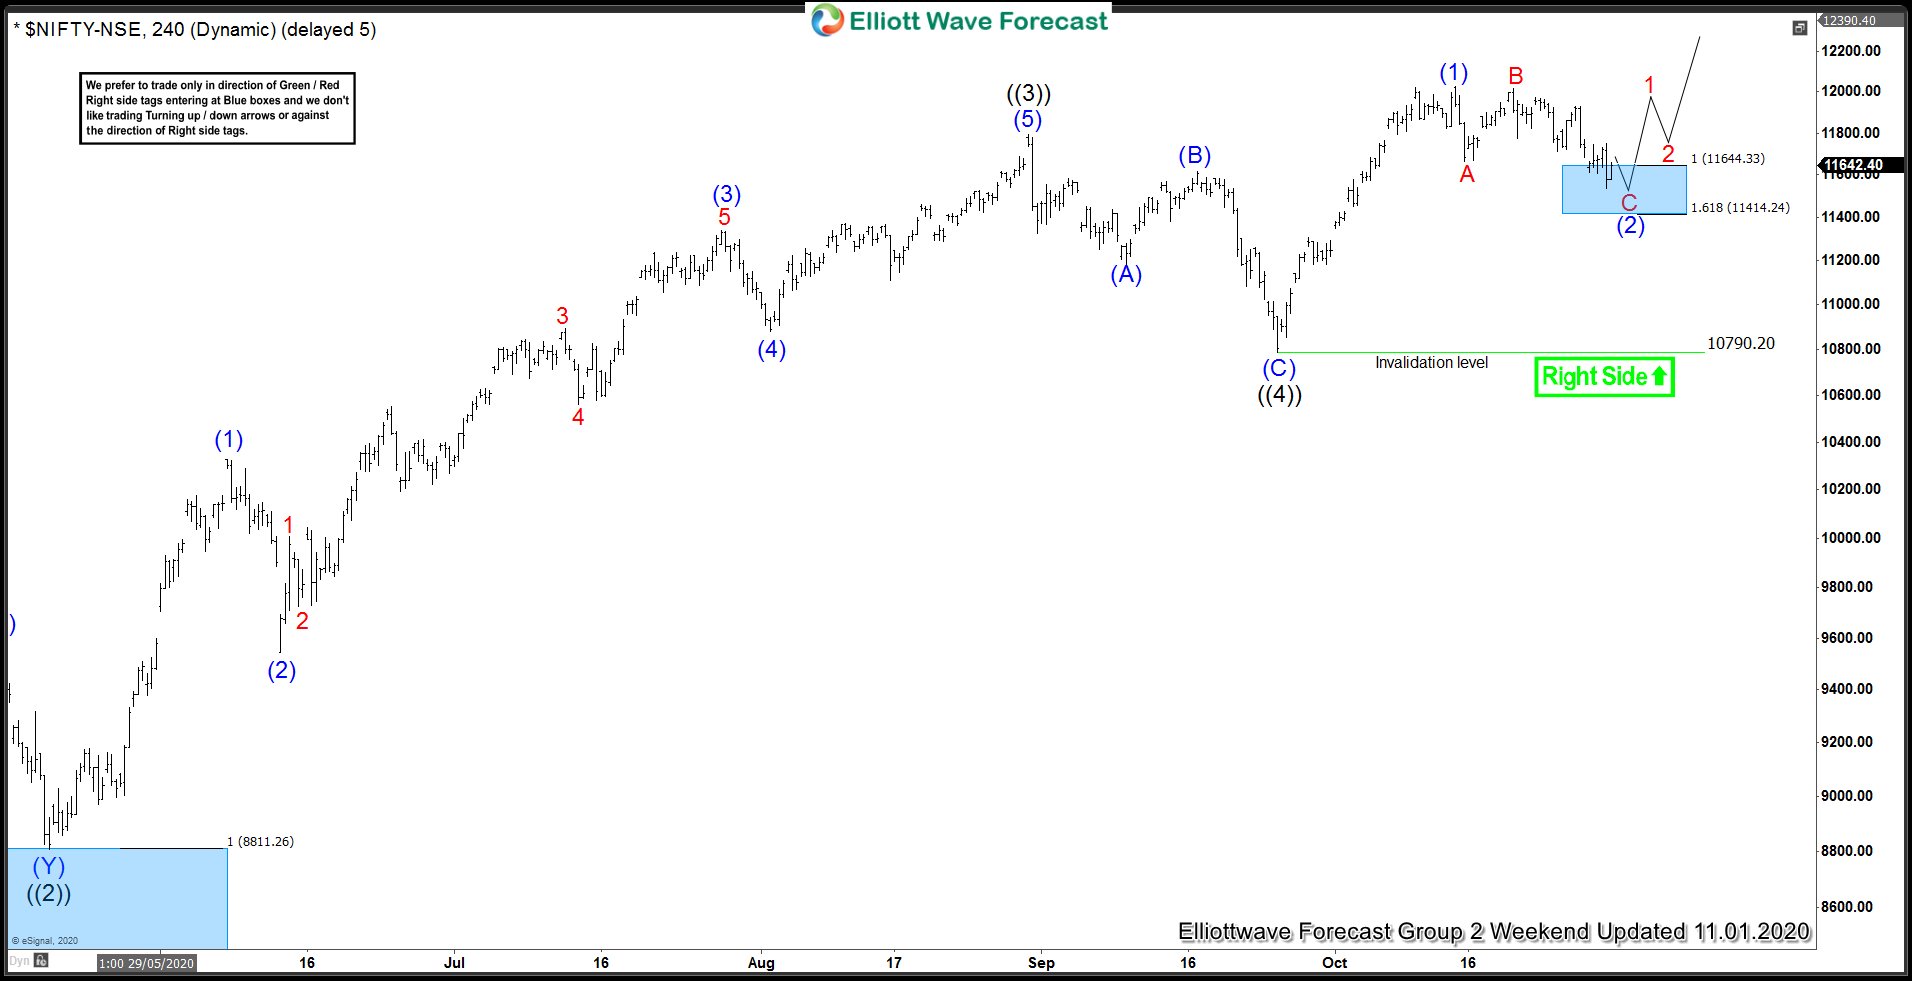
Nifty 4 Hour Elliott Wave Analysis 11.1.2020
Chart below shows Impulse Elliott Wave Structure from March 2020 low is still in progress and within this impulse structure wave ((3)) completed at 11794.25 and wave ((4)) completed at 10790.20. This was followed by rally to a new high to 12025.45 which could have been all of wave ((5)) but based in market correlation, we anticipated an extended wave ((5)) and labelled the rally to 12025.45 as just wave (1) of ((5)). As per Elliott Wave Theory, after a complete 5 waves move, there should be a pull back in 3 waves at least. We can see that Index pulled back in 3 waves and already reached the blue box area which we highlighted as an area to complete wave (2) pull back and expected buyers to appear in the blue box and resume the rally in wave (3) of ((5)) or produce 3 waves bounce at least.

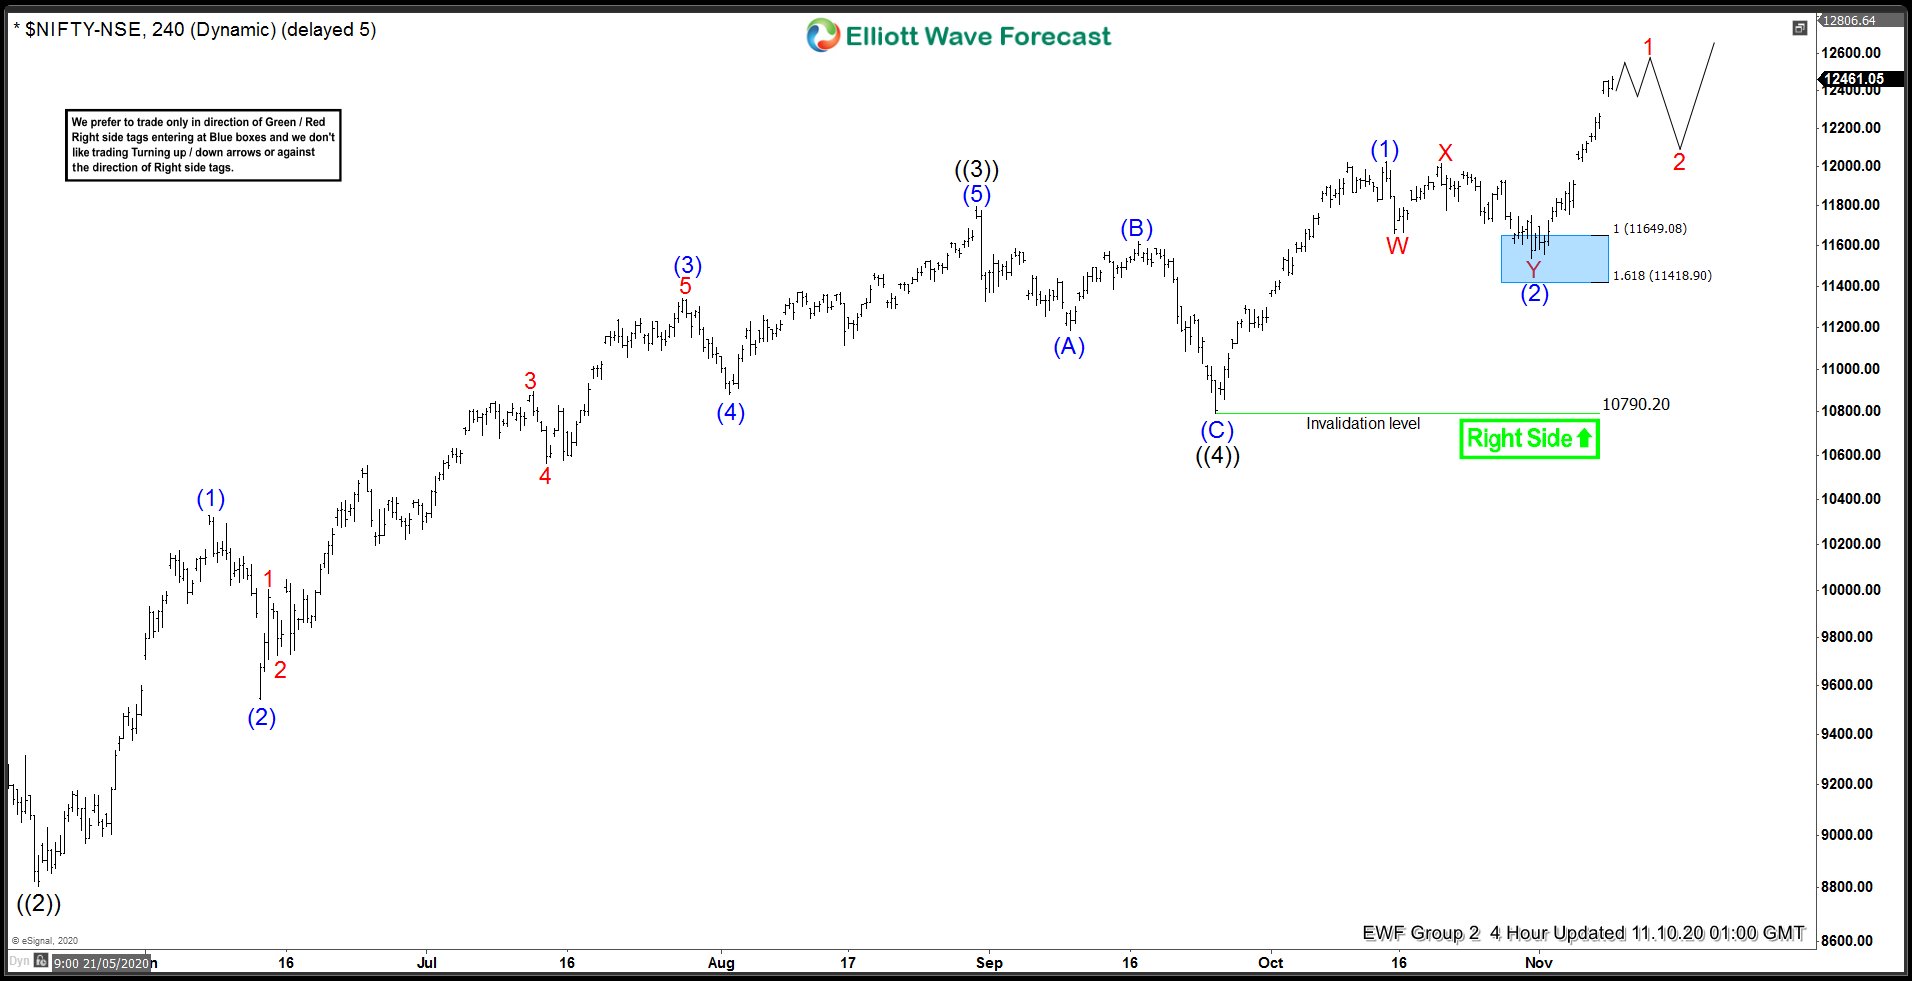
Nifty 4 Hour Elliott Wave Analysis 11.9.2020
Nifty completed the pull back in the blue box and buyers entered as expected. Index resumed the rally and has already made a new high above 12025.45 peak exposing 12766 – 13057 as the next target area. We could either be nesting or the mentioned area would complete wave (3) of ((5)). In either case, more upside should take place.


