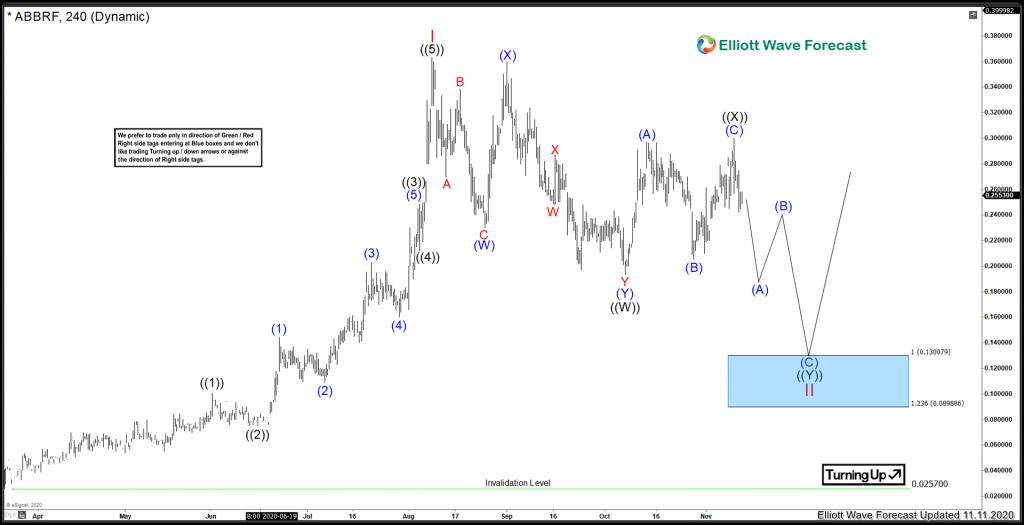
The Metals sector has been slowly coming back since the lows in late 2015 and is ready for prime time attention after Gold has recently made new all time highs. Abraplata a Jr. silver, gold, and copper explorer. As such, has a very volatile chart but follows spot silver fairly closely in swings. Abraplata has projects in Argentina and Chile, at various stages of exploration, from drill-ready to PEA stage.
The company is focused on further advancing its 100%-owned Diablillos silver-gold project in the mining-friendly Salta province of Argentina, which contains a large resource base of 80.9 million ounces of silver and over 730,000 ounces of gold in the Indicated category.
We are going to take a look at chart since the all time low set in March 2020. This is an OTC ticker, the Canadian Symbol ABRA.CA will have the same count, but priced in Canadian dollars.
Abraplata Elliottwave View:

Since the March 2020 lows, the count is showing a clear impulsive structure into the August Peak. Red I is favoured to have set at 0.36 on August the 10th, 4 days after Silver peaked. At this point in time, it is good to have some patience for another swing lower to an extreme area. The blue box area on this chart, is an area where a bounce can take place in 3 swings at least. We do not like to trade the middle of a trend, but like to trade extreme areas (shown in the blue box).
Presently, the chart is still favouring one more swing lower in a double correction, to the 0.13 area. As this is a penny stock, it is important to use proper risk management. The technicals on this chart are fairly clean, and I favour the price structure to track silver closely until silver sets a low also.
Risk Management
Using proper risk management is absolutely essential when trading or investing in a volatile stocks. Elliott Wave counts can evolve quickly, be sure to have your stops in and define your risk when trading.

