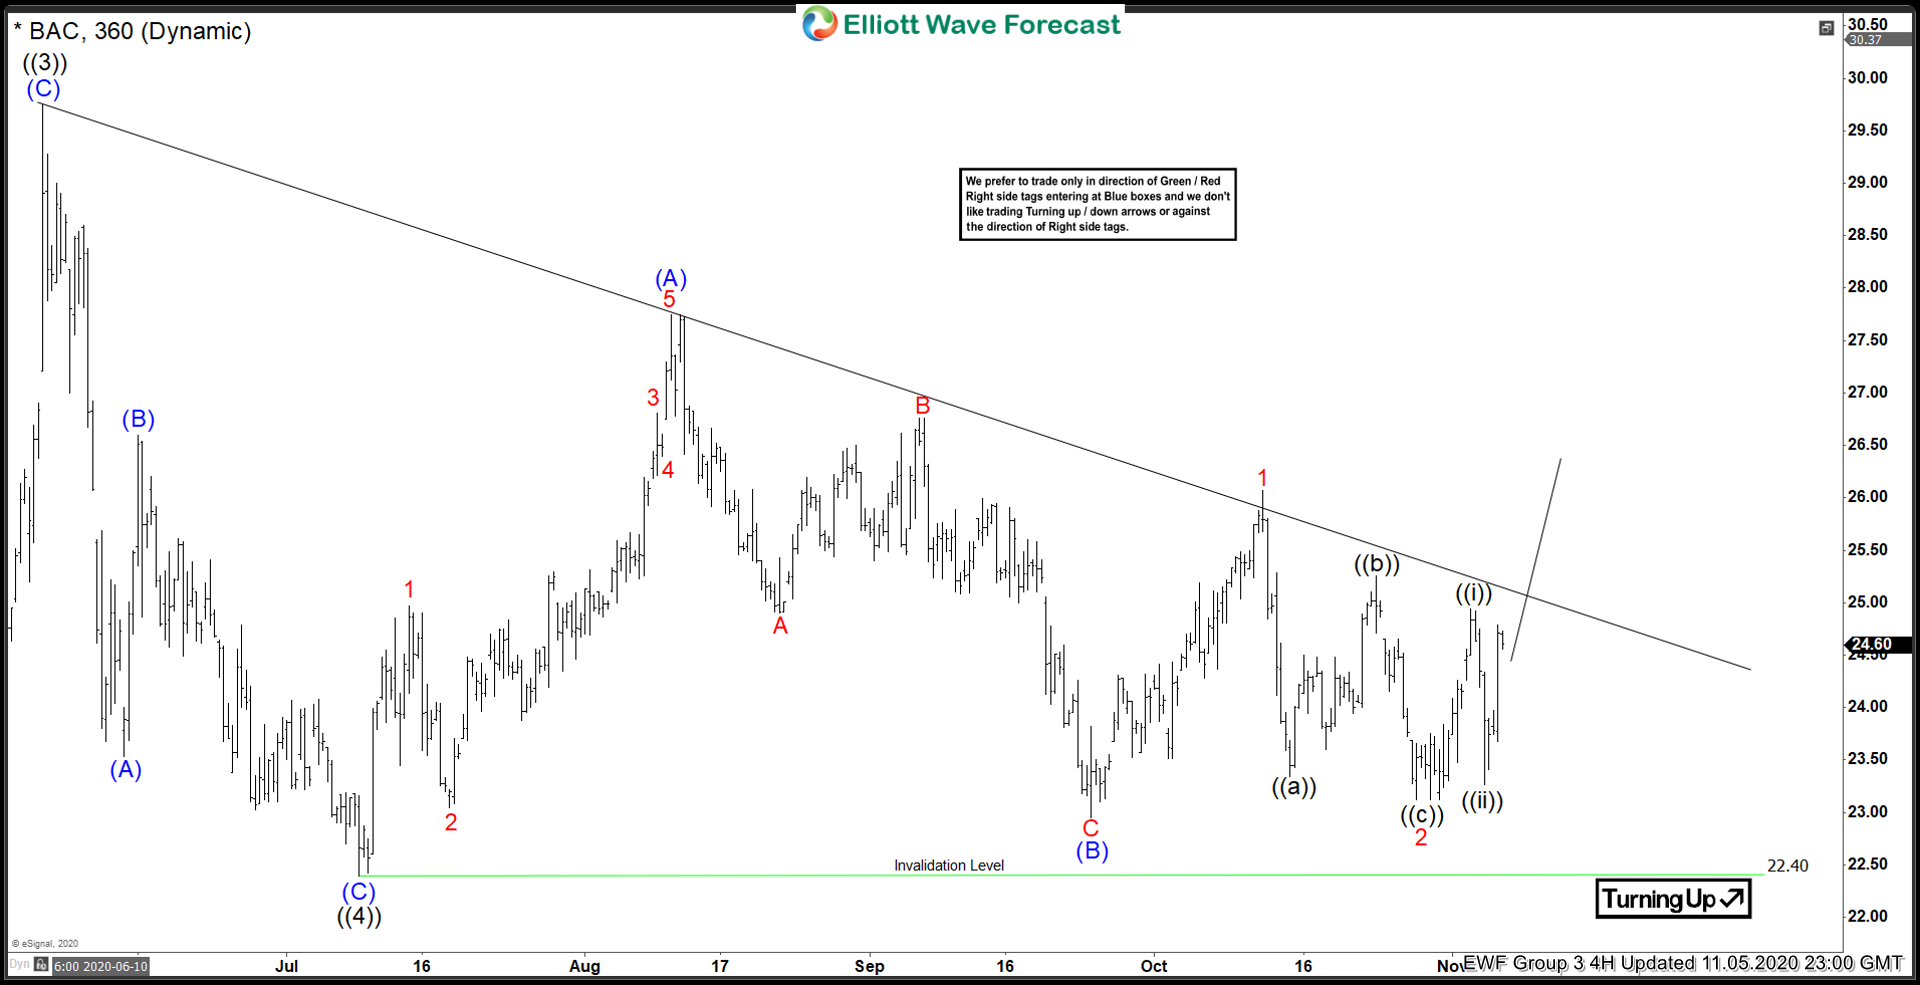
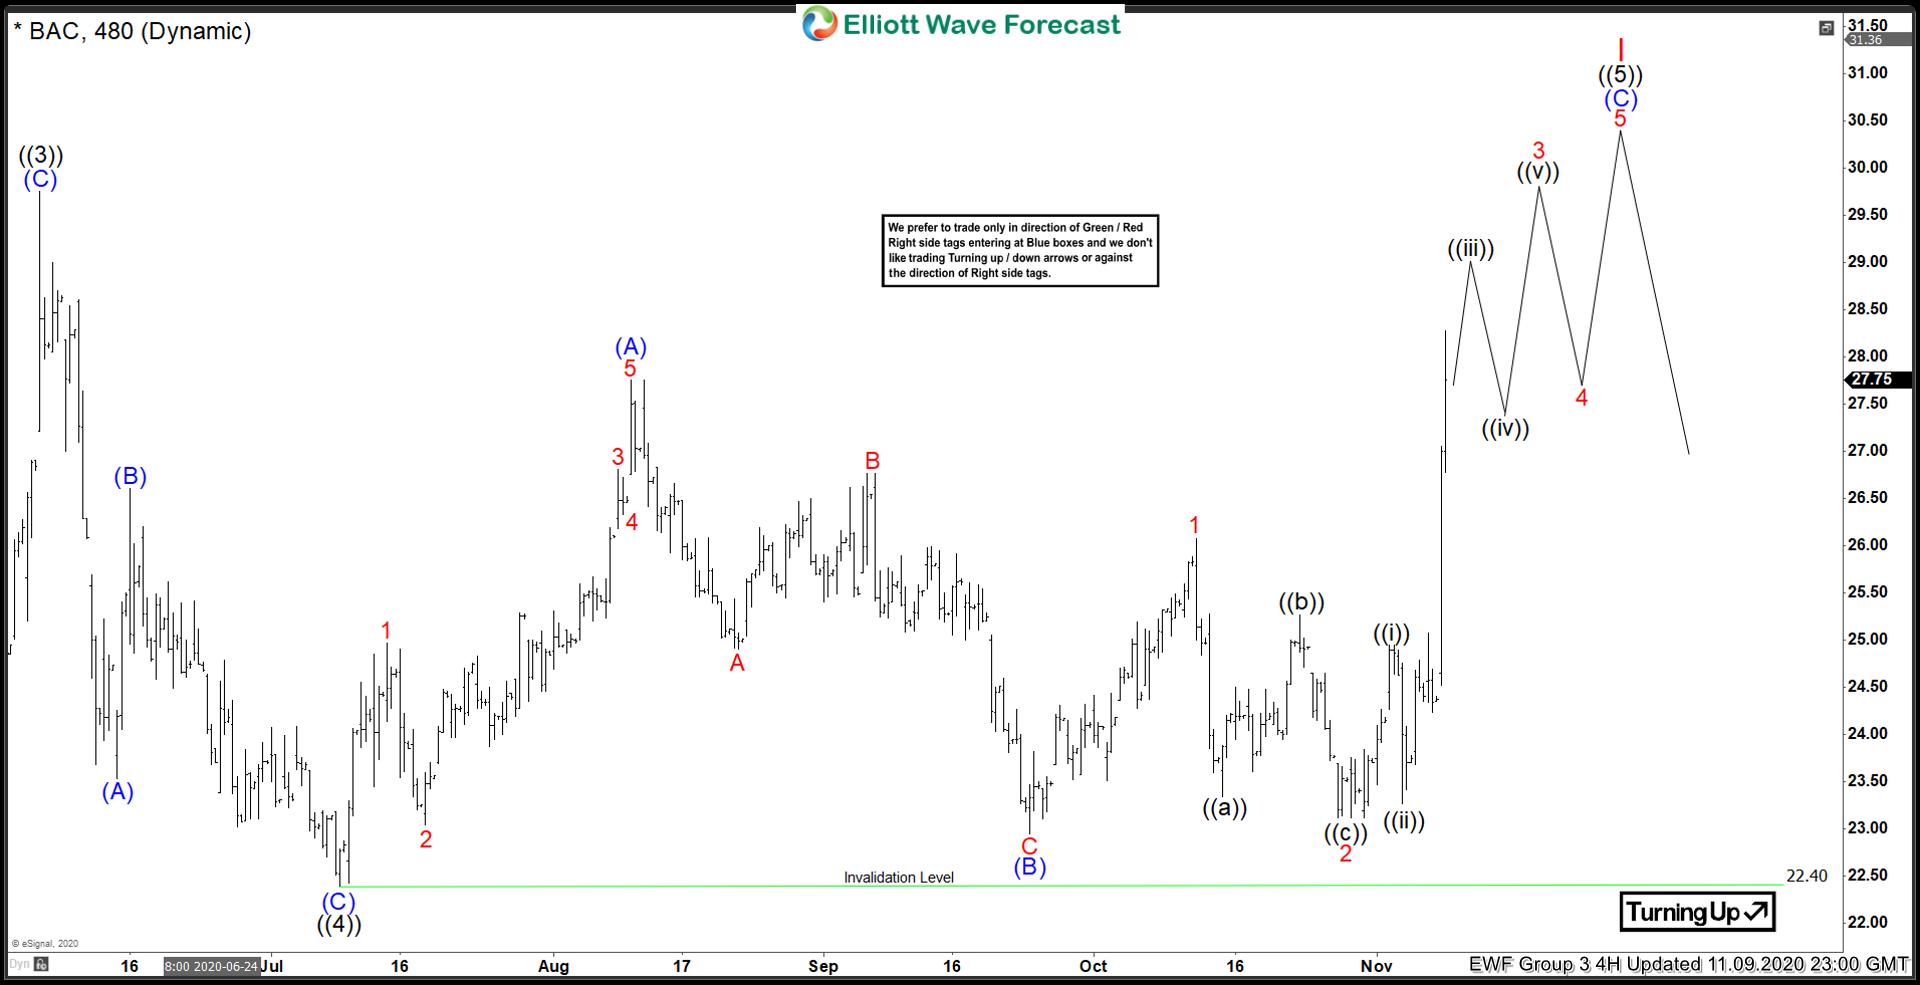
Bank of America ended a movement in ranges that had been in place since June, after a slight recovery from the drawdown in March due to COVID-19. The global capital markets woke up stimulated with a strong risk appetite on November 9th, this made that stocks such as Bank of America could come out of their slumber of months. A range that was getting smaller and smaller, which for technical analysts like us, it was an alert indicated that something was going to break the range very soon.
Bank of America Range Phase
For the month of June, $BAC peaked at $28.93 followed by a 3 waves movement that we call (A) (B) (C) as wave ((4)), a typical zig-zag correction in Elliott waves (for more information on Elliott waves go to this link, Elliott waves). Then the stock made a high low what we call (A) and a low high we call (B), looking for a flat formation that would give us a strong bullish continuation. However, the high lows and low highs continued to come to create a triangle formation as we see in the chart.

Breaking the Range
The month of November came and Bank of America shares were still aimless after 5 consecutive months. The range had narrowed further and we were on the lookout that a breakout was imminent. And on November 9, stocks finally exploded higher, after a hesitant start, but more because of the risk appetite presented by the markets worldwide. Coincidence, I don’t know, but we looked for the upside breakout and it did. We are currently looking for the stock to trade above 28.92 before selling begins and we see a major correction.

In Elliottwave Forecast we update the one-hour charts 4 times a day and the 4-hour charts once a day for all our 78 instruments and also the blue boxes and rigth side mark. We do a daily live session where we guide our clients on the right side of the market. In addition, we have a chat room where our moderators will help you with any questions you have about what is happening in the market at the moment.
