We wrote an article on Pan American Silver Corporation ticker: PAAS) in June 28 earlier this year. In this article, we argued the stock has a bullish outlook. We also presented a set of Elliott Wave Charts in various time frames. In this blog, we want to follow up and update the count of the stock.
The recent good news on the virus vaccine and the lack of second fiscal stimulus has contributed to the weakness in precious metals. Consequently, the stock price of PAAS also suffers further setback. However, despite the weakness in precious metals, ultra loose monetary policy by central banks and the expectation of further fiscal stimulus should continue to provide long term support to the precious metals.
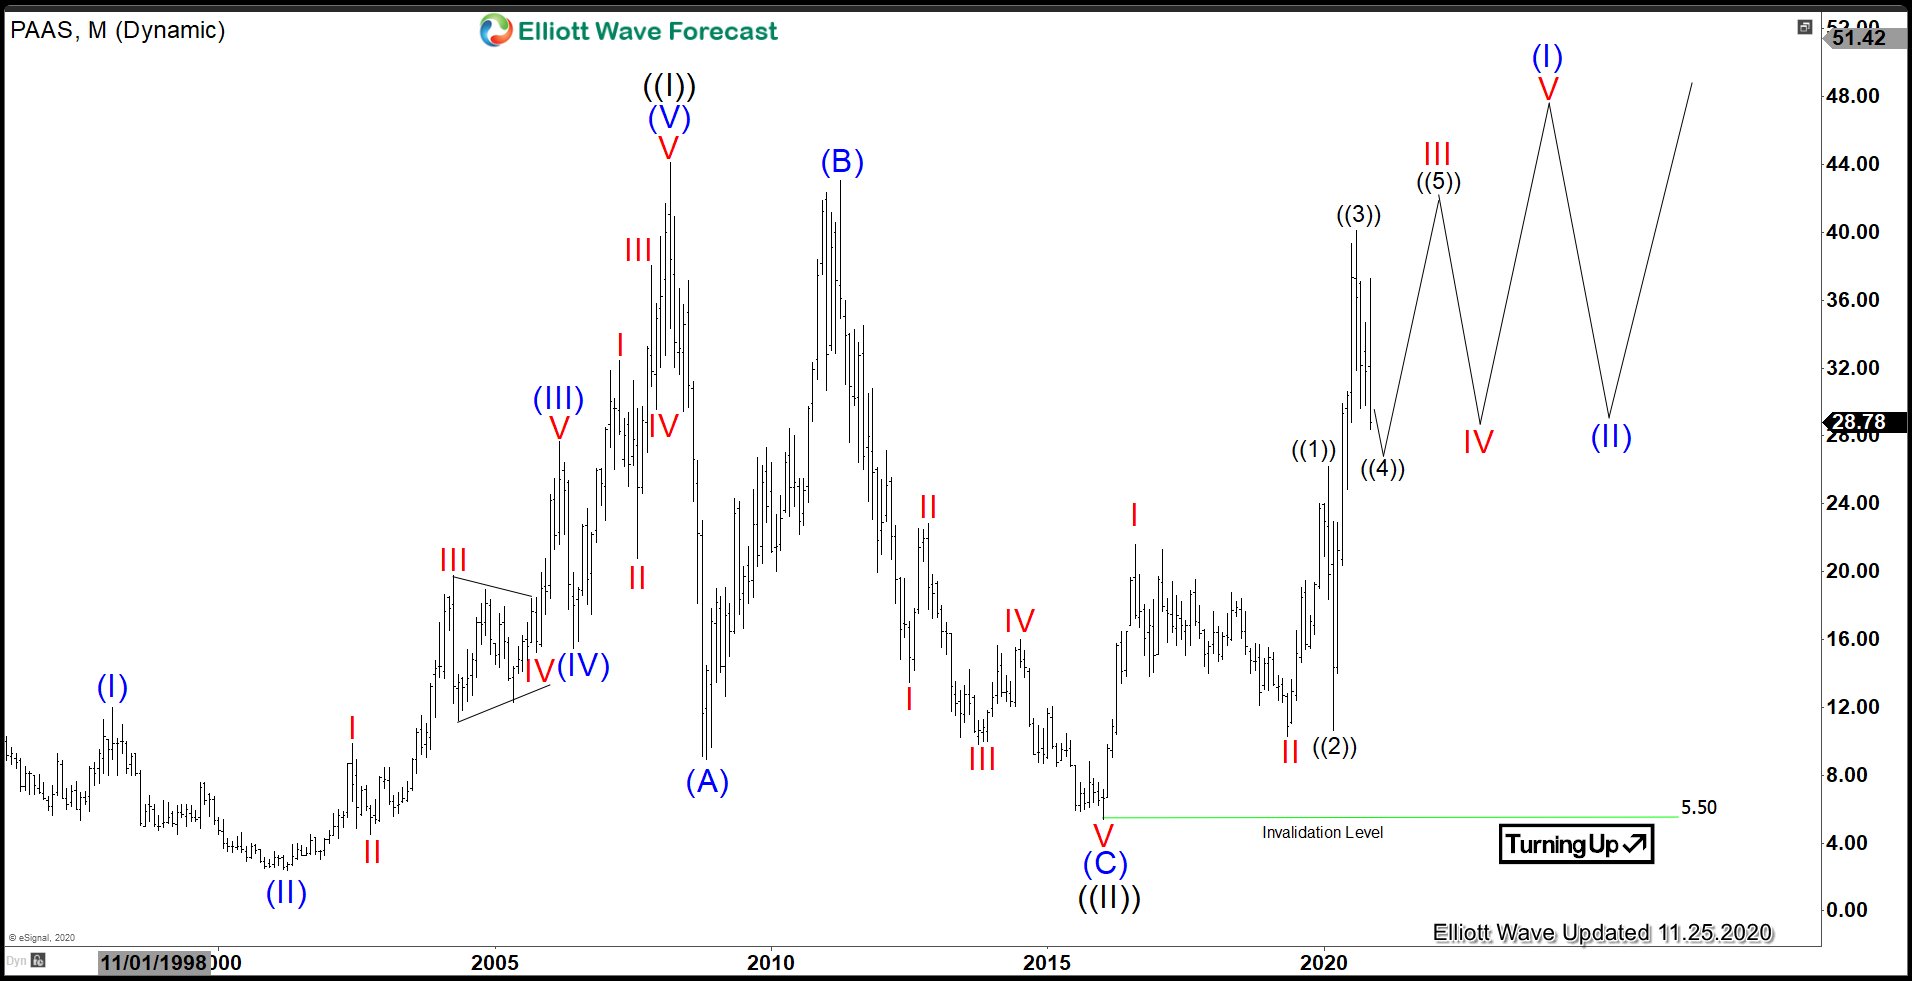
PAAS Monthly Elliott Wave Chart

Monthly chart of PAAS above shows an impulsive rally from wave ((II)). Structure of the rally is proposed to be in a nest, and current wave ((4)) of III pullback should complete soon. If this count is correct, then wave ((4)) should not overlap with wave ((1)) at $26.2, so that will be the floor for the recent weakness.
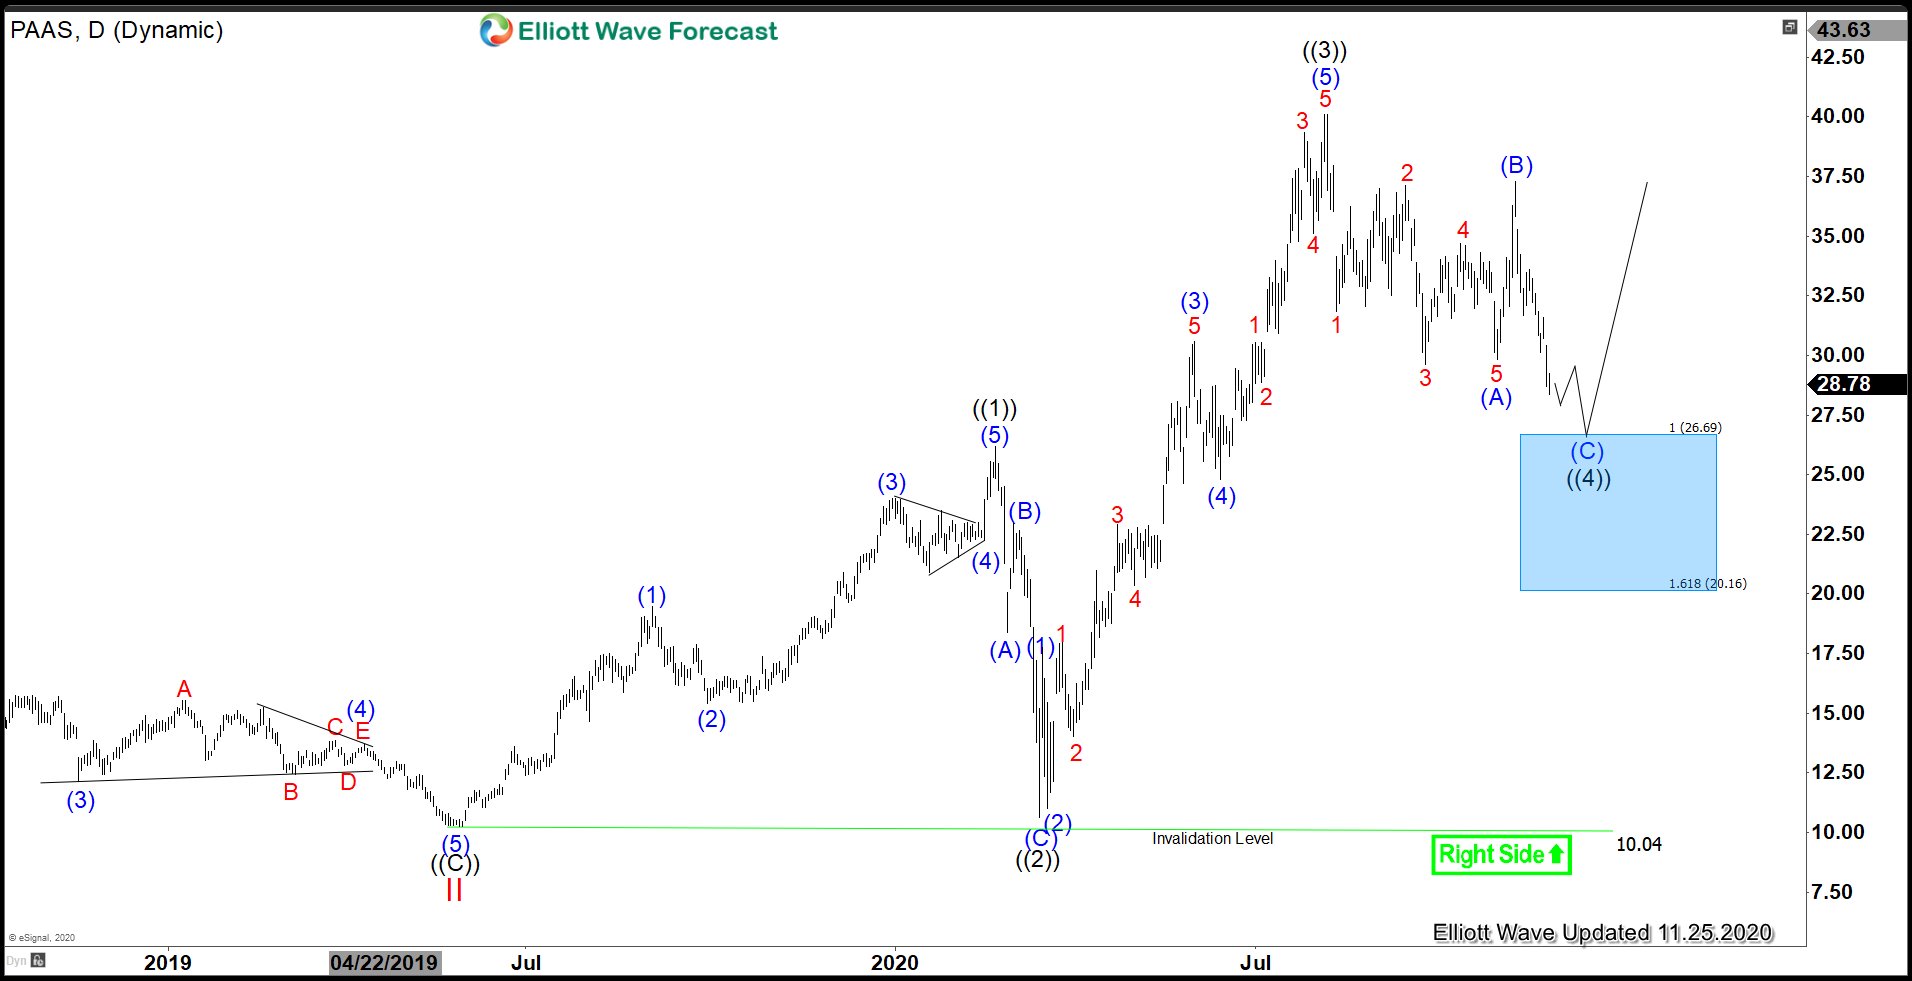
PAAS Daily Elliott Wave Chart

Daily Elliott wave chart of PAAS above shows that the stock made a top on August 5 ($40.11) and since then continues to be in correction in wave ((4)). The decline looks to be unfolding as a zigzag structure where wave (A) ended at $29.52 and wave (B) ended at $37.28. Expect the stock to find support at the 100% – 161.8% fibonacci extension of (A)-(B) at $20.1 – $26.7. From this area, the stock should end wave (C) of ((4)) and resume higher or bounce in 3 waves at least.
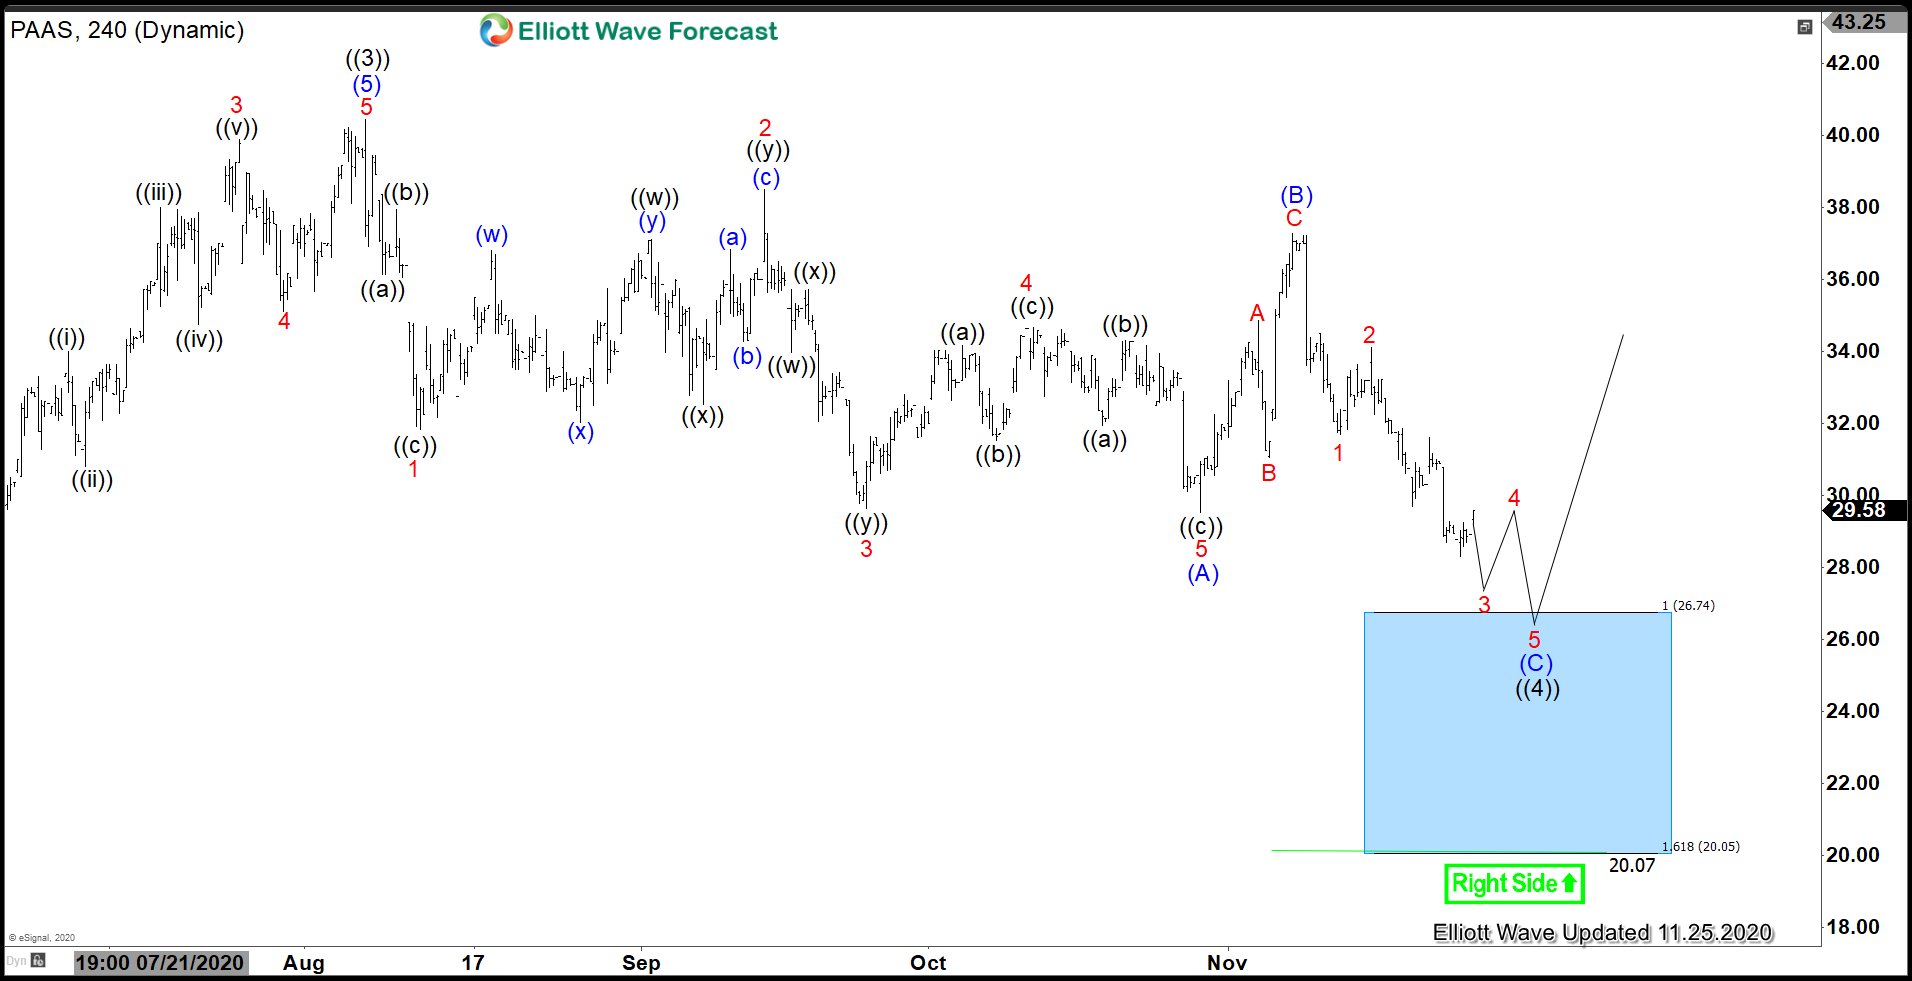
PAAS 4 Hour Elliott Wave Chart

4 Hour chart of PAAS above shows that wave ((4)) pullback remains in progress and has scope to see further downside to reach 20.1 – 26.7 before buyers appear. The decline in the stock therefore is close to completion and it can soon resume the next leg higher or rally in larger 3 waves at least.

