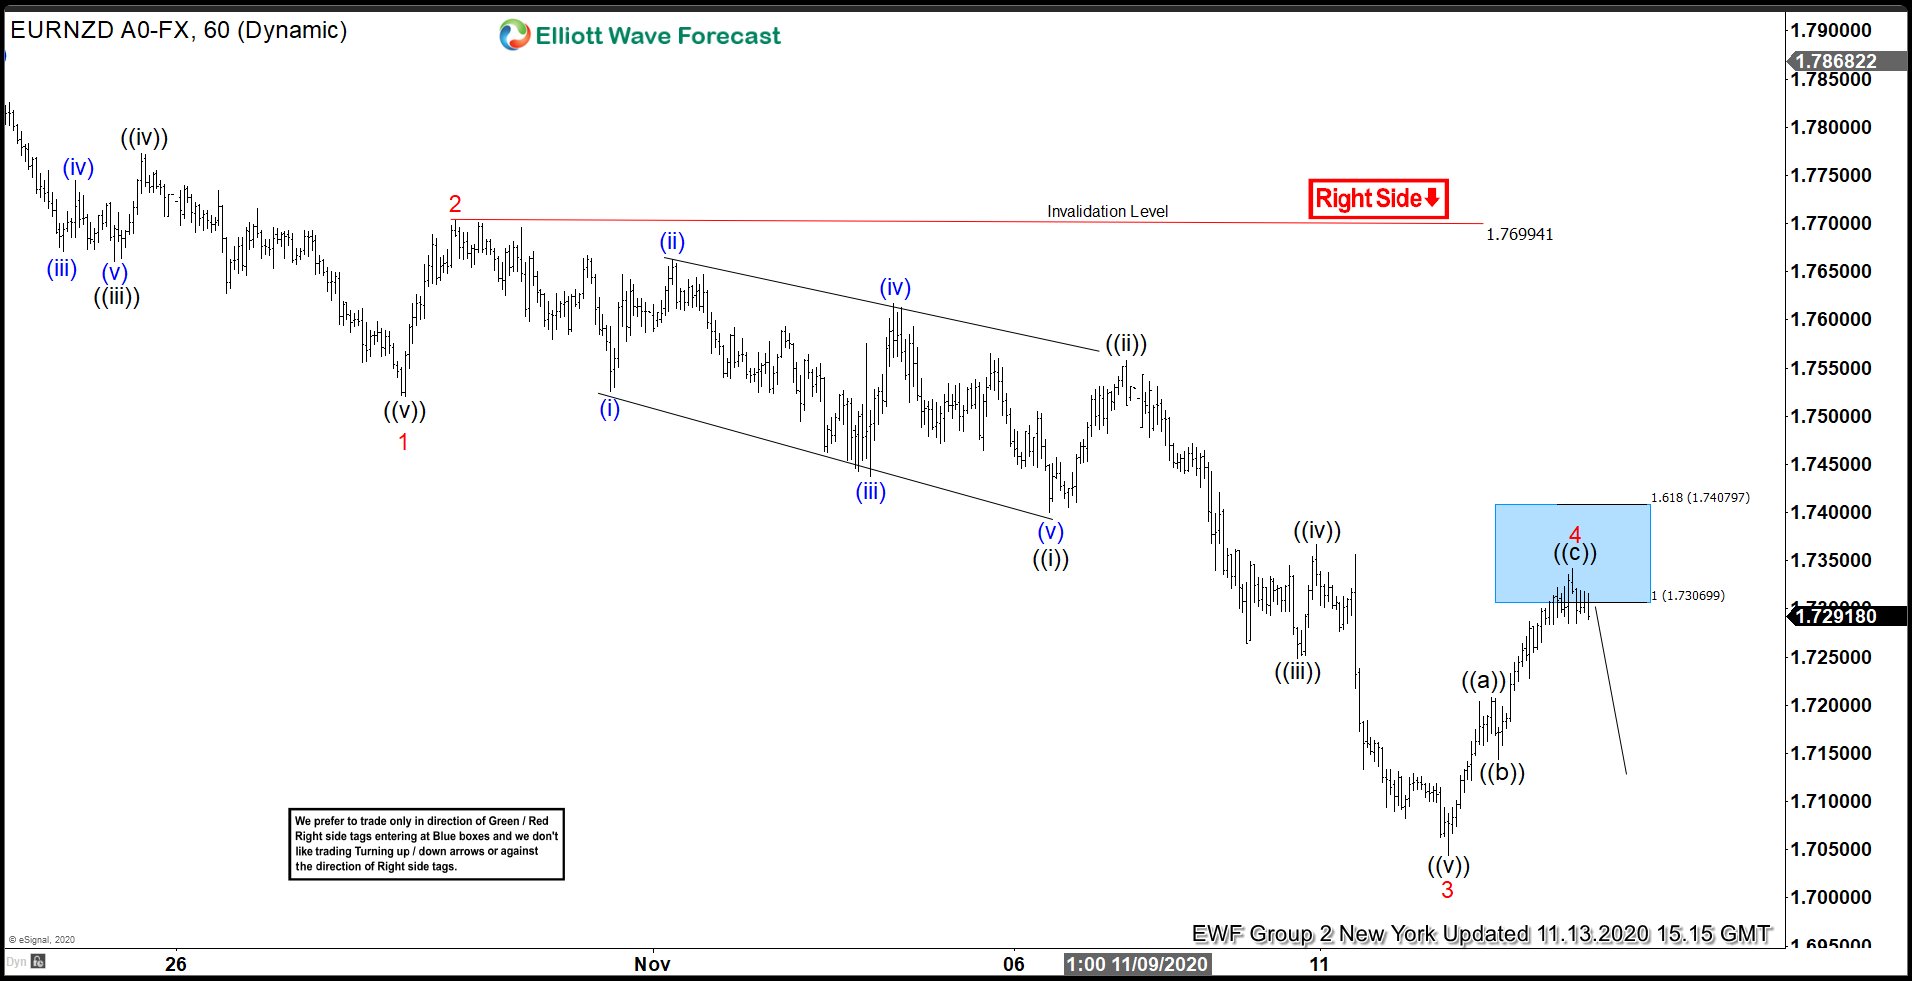
EURNZD this week dropped to a new low and traded at it’s lowest level since 21st February 2020. The recent decline started after sellers entered in our blue box area. In this article, we will look at some recent charts from members area calling for the bounce to get rejected in the blue box for new lows and how the decline unfolded after that. Let’s start by taking a look at 1 Hour chart from November 13, 2020.
EURUZD 1 Hour Elliott Wave Analysis 11.13.2020
Chart below shows EURNZD is in an impulsive decline when wave ((i)) of 3 completed at 1.7400, wave ((ii)) of 3 completed at 1.7557, wave ((iii)) of 3 completed at 1.7248, wave ((iv)) of 3 completed at 1.7366 and wave ((v)) of 3 completed at 1.7043. Following this pair started a wave 4 bounce which took the form of a Zigzag Elliottwave correction and reached blue box area between 1.7306 – 1.7407 which is basically 100- 161.8 % Fibonacci extension area of ((a)) related to ((b)). In the chart below, we called wave 4 bounce completed at 1.7343 and expected the decline to resume in wave 5 However, even if the pair made a new high above 1.7343, it should still be treated as a wave 4 as far as pric stayed below 161.8 Fibonacci extension of ((a)) related to ((b)) at 1.7407.

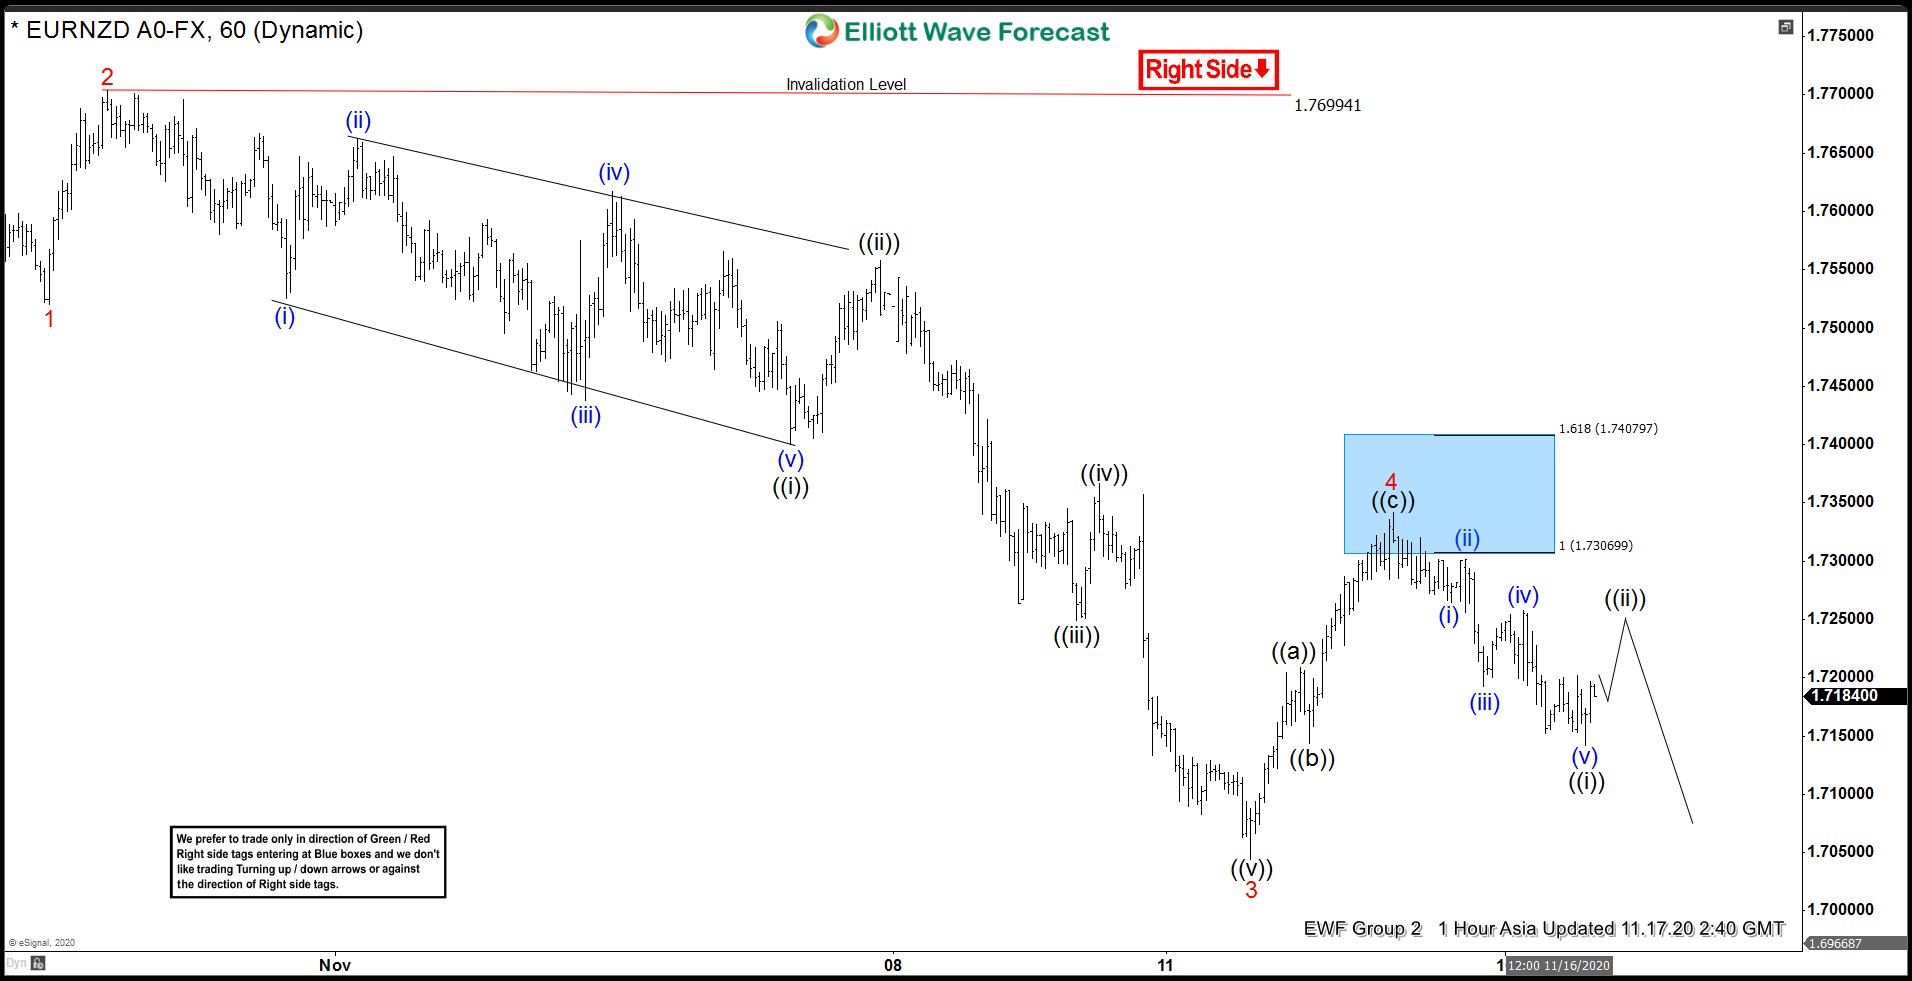
EURNZD 1 Hour Elliott Wave Analysis 11.17.2020
Chart below shows sellers did appear in the blue box and pair resumed the decline, pair is showing 5 swings down from wave 4 peak (1.7343) suggesting wave ((i)) is complete at 1.7142, wave ((ii)) bounce is in progress and as it fails below 1.7343 high, we expect the decline to resume. Price already reached 50% retracement of the rally from black ((b)) low so any sellers which entered in the blue box should already be in a risk free position.

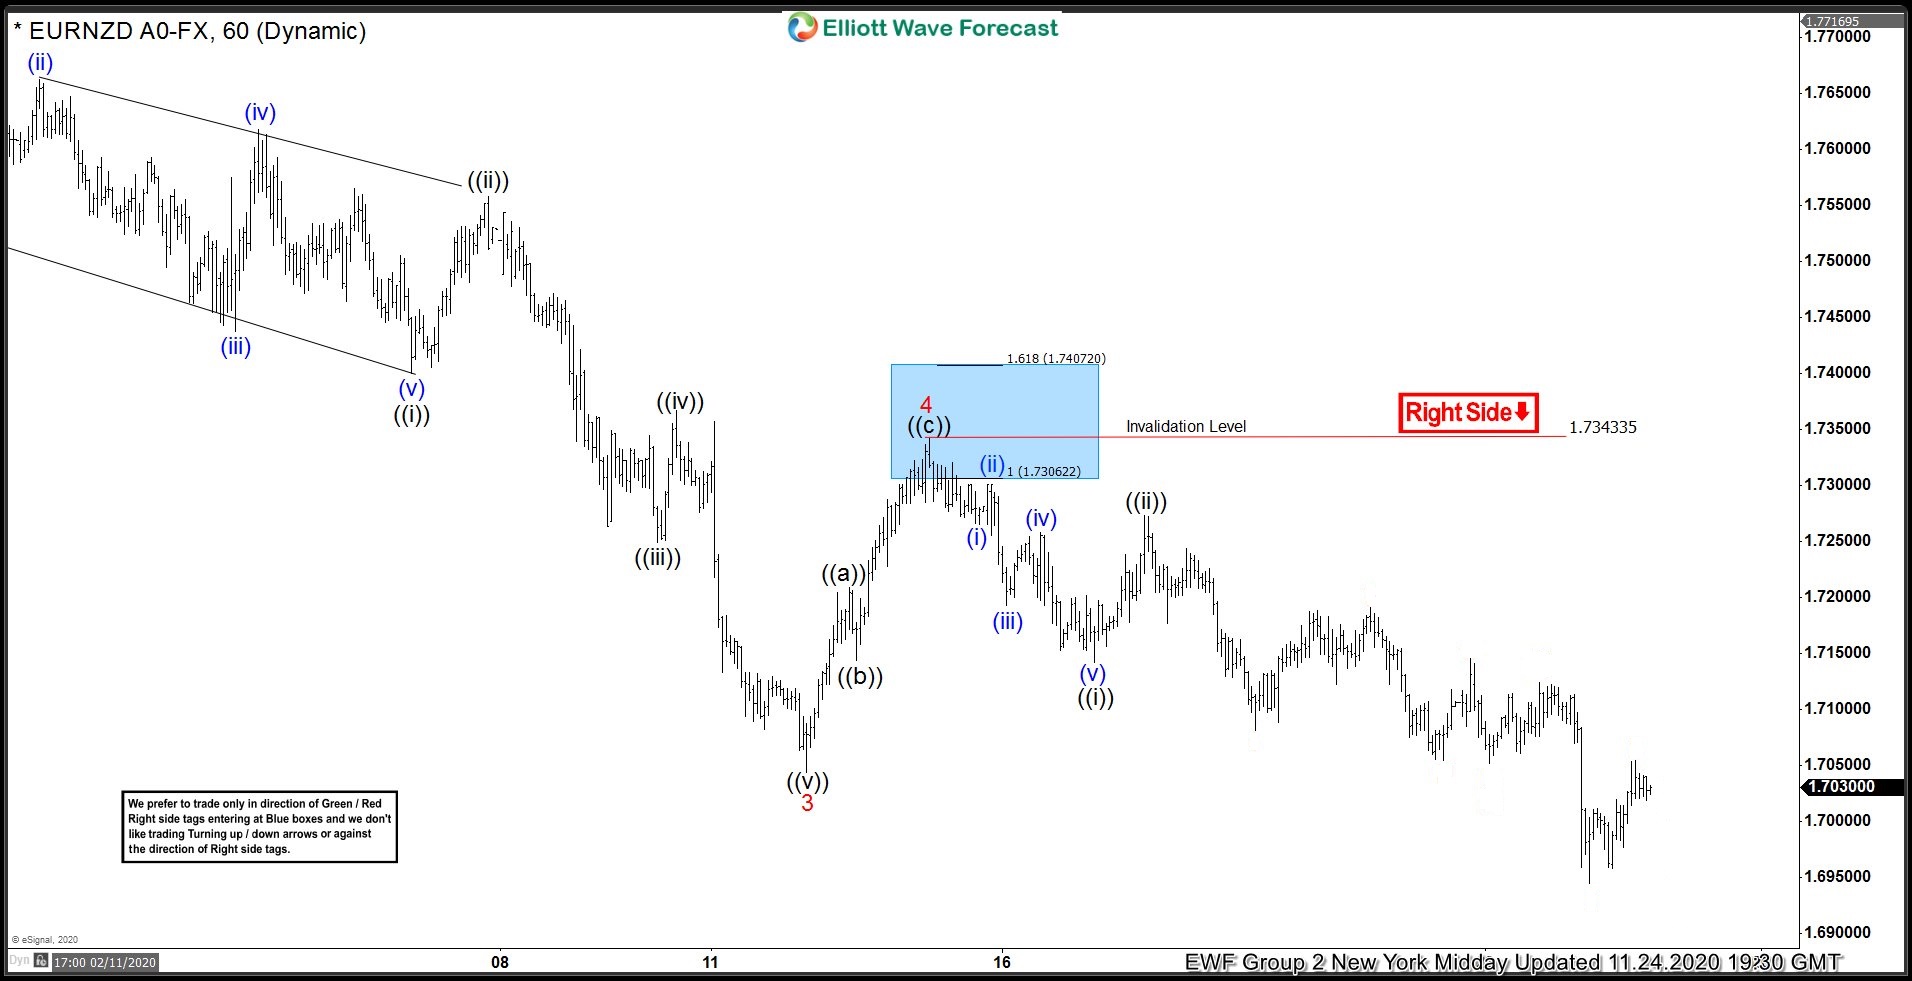
EURNZD 1 Hour Elliott Wave Analysis 11.24.2020
Proposed wave ((ii)) bounce failed below 1.7343 peak as expected and pair went on to make a new low below wave 3 low confirming the bounce was indeed wave 4 and new low is part of wave 5.

Source: https://elliottwave-forecast.com/forex/eurnzd-gets-blue-box-rejection/

