
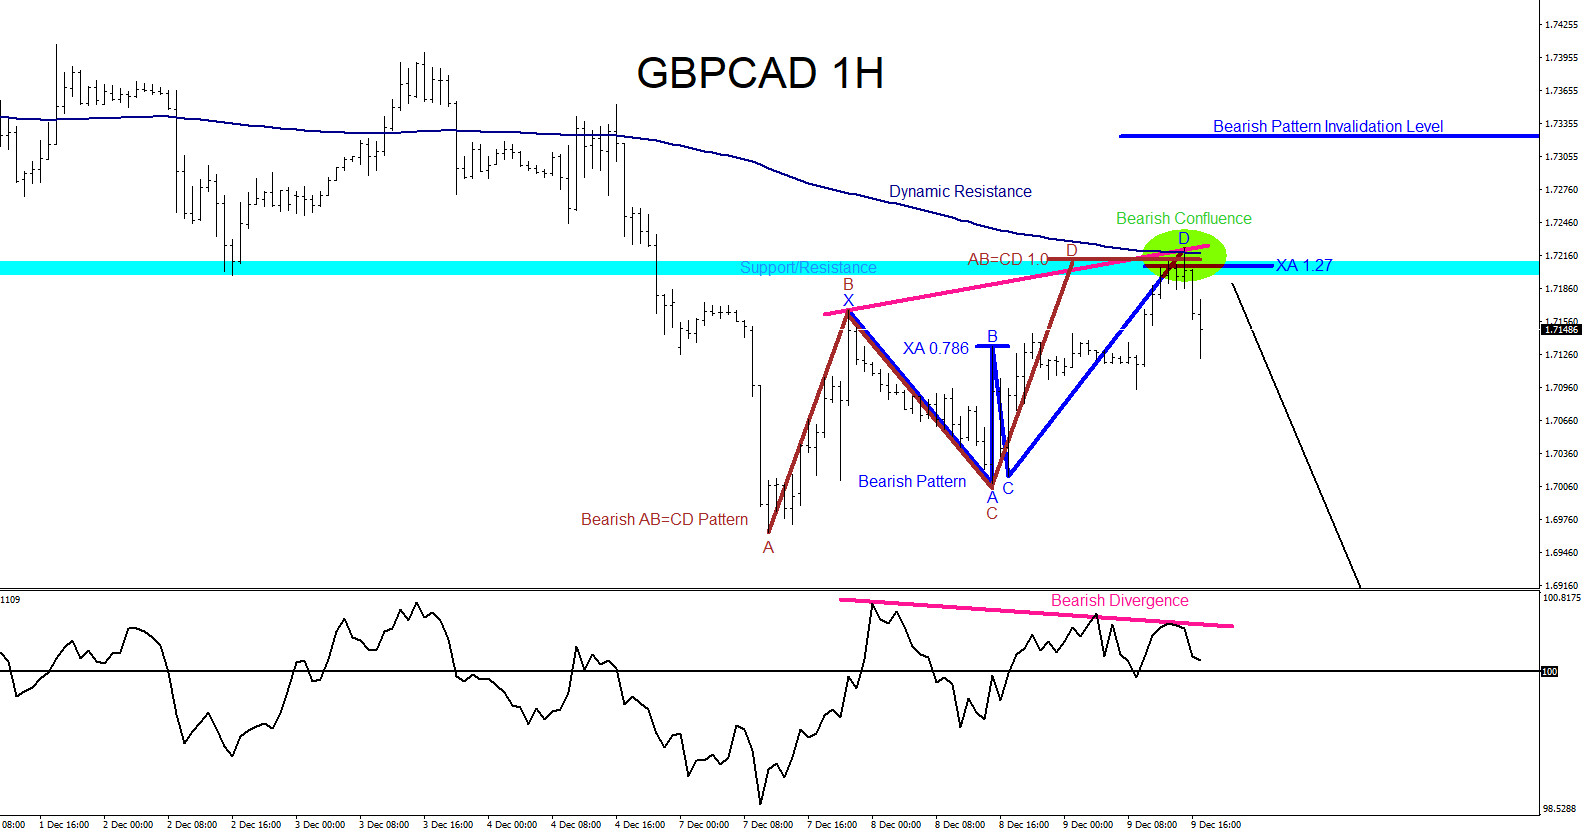
On December 9 2020 I posted on social media @AidanFX “GBPCAD watch for selling opportunities.”
The charts below were also posted on social media @AidanFX December 9 2020 showing the possible bearish patterns. Blue bearish pattern triggered SELLS at the XA 1.27% Fib. retracement level and the brown AB=CD bearish pattern also triggered SELLS in the same area at the Fib. extension 1.0% level. Both these levels triggered sellers in a strong bearish confluence area where the SELL levels were met with a support/resistance zone (light blue) and dynamic resistance of the 200 moving average (dark blue). Also to add more reason the pair could push lower a bearish divergence pattern (pink) also formed in the same confluence area. I called for the pair to push lower and advised traders to watch for selling opportunities.
GBPCAD 1 Hour Chart December 9 2020
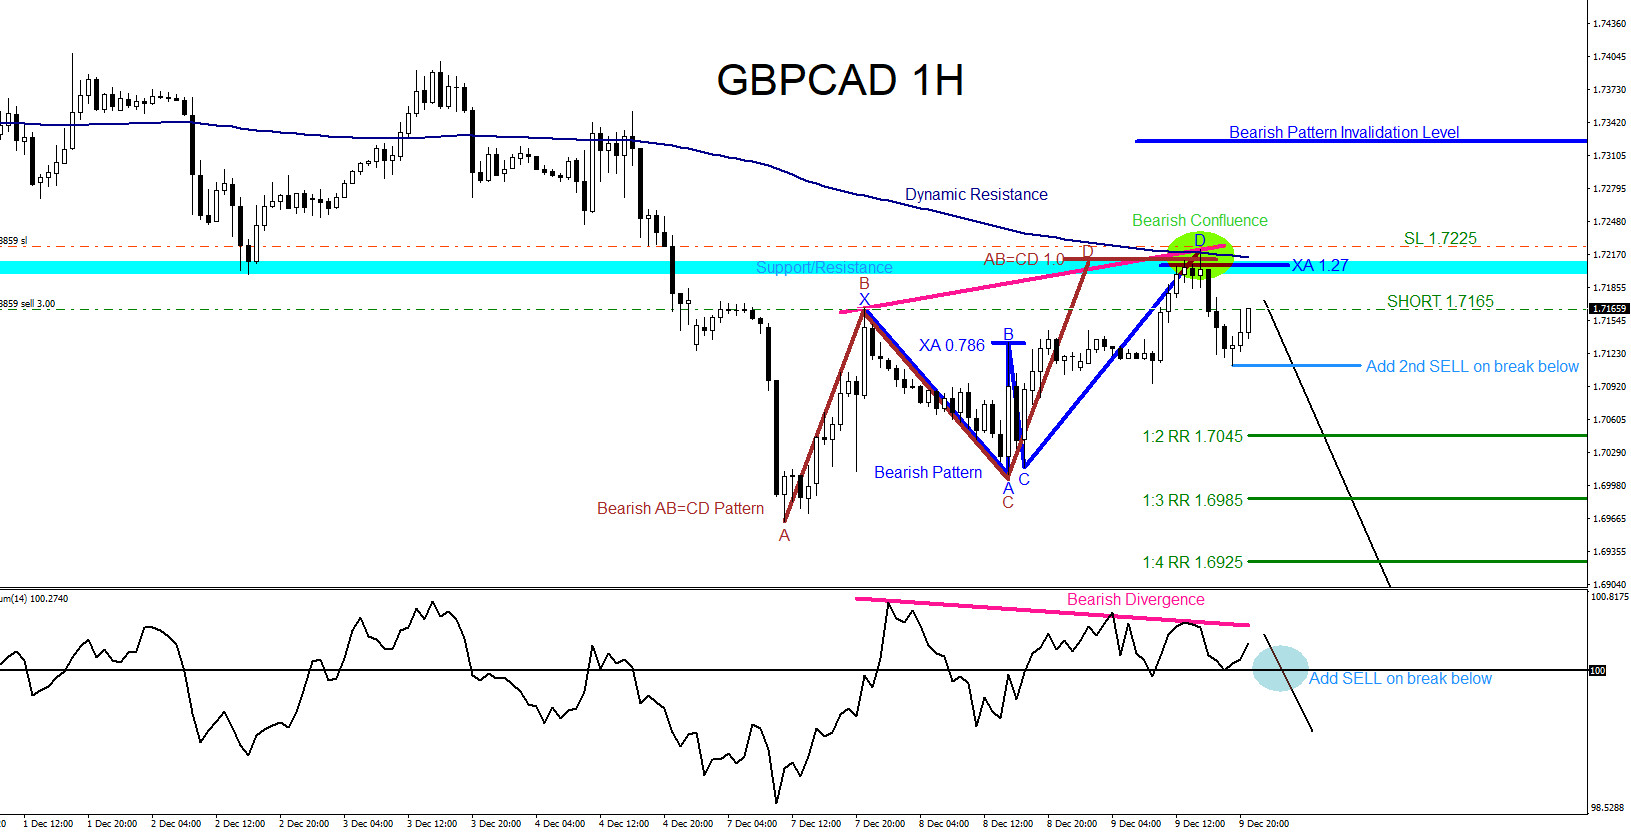
GBPCAD 1 Hour Chart December 9/2020 (1st SELL Entry)
After a minor pullback, I posted the first SELL trade at 1.7165 (green) with stops at 1.7225 expecting for green targets to hit on the possible move lower. I also advised traders to look for the second SELL entry if price breaks below the 1.7111 level (light blue) and if the bottom momentum indicator breaks below the 100 level.
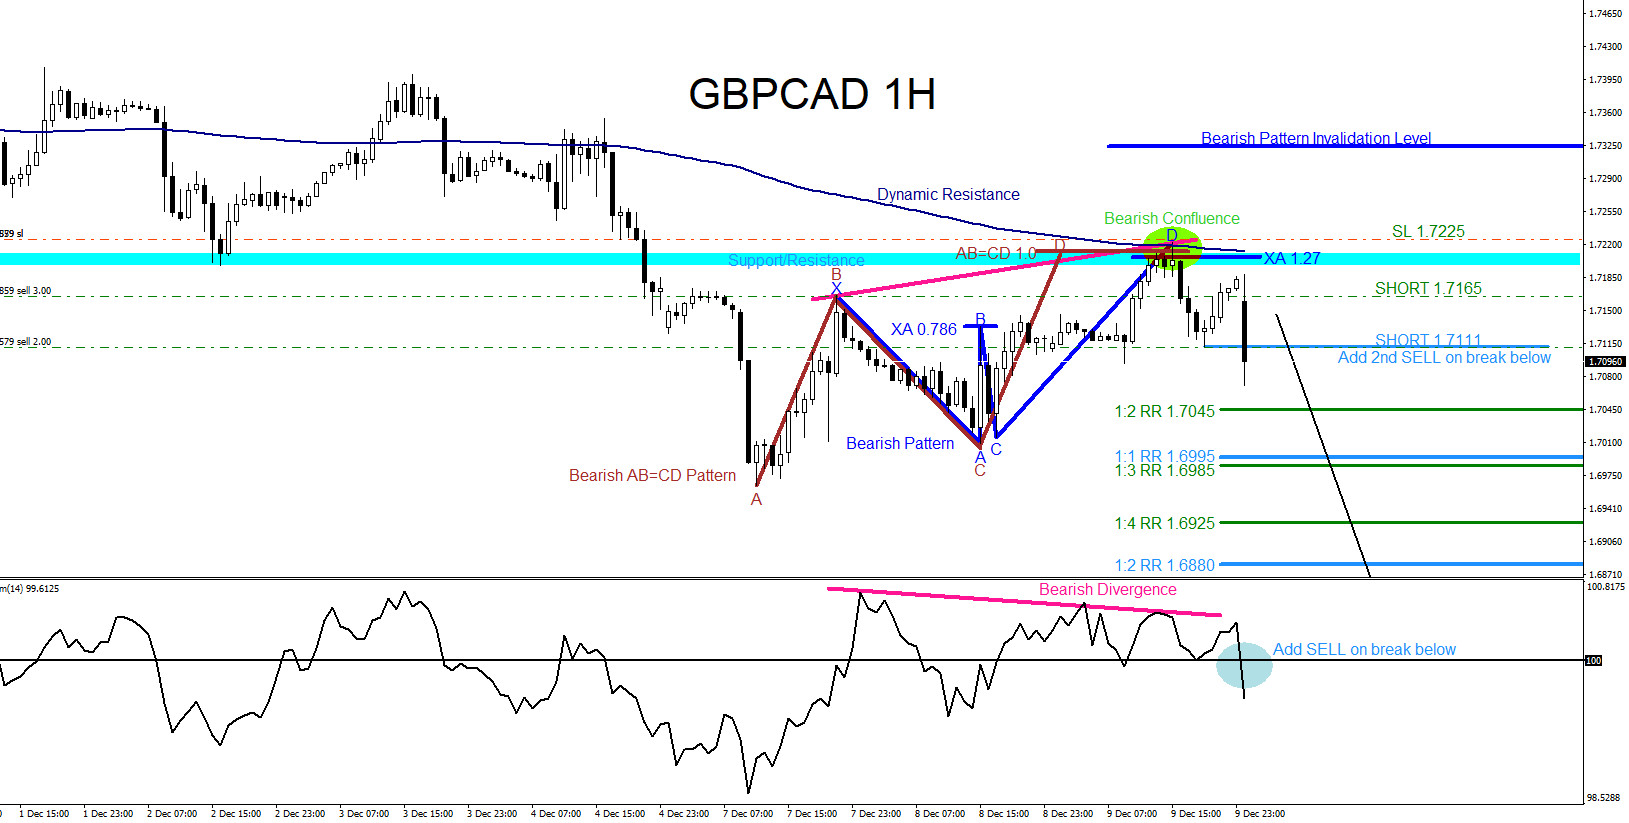
GBPCAD 1 Hour Chart December 9/2020 (2nd SELL Entry)
Price breaks below 1.7111 level and indicator breaks below 100 level. Second SELL entry triggered.
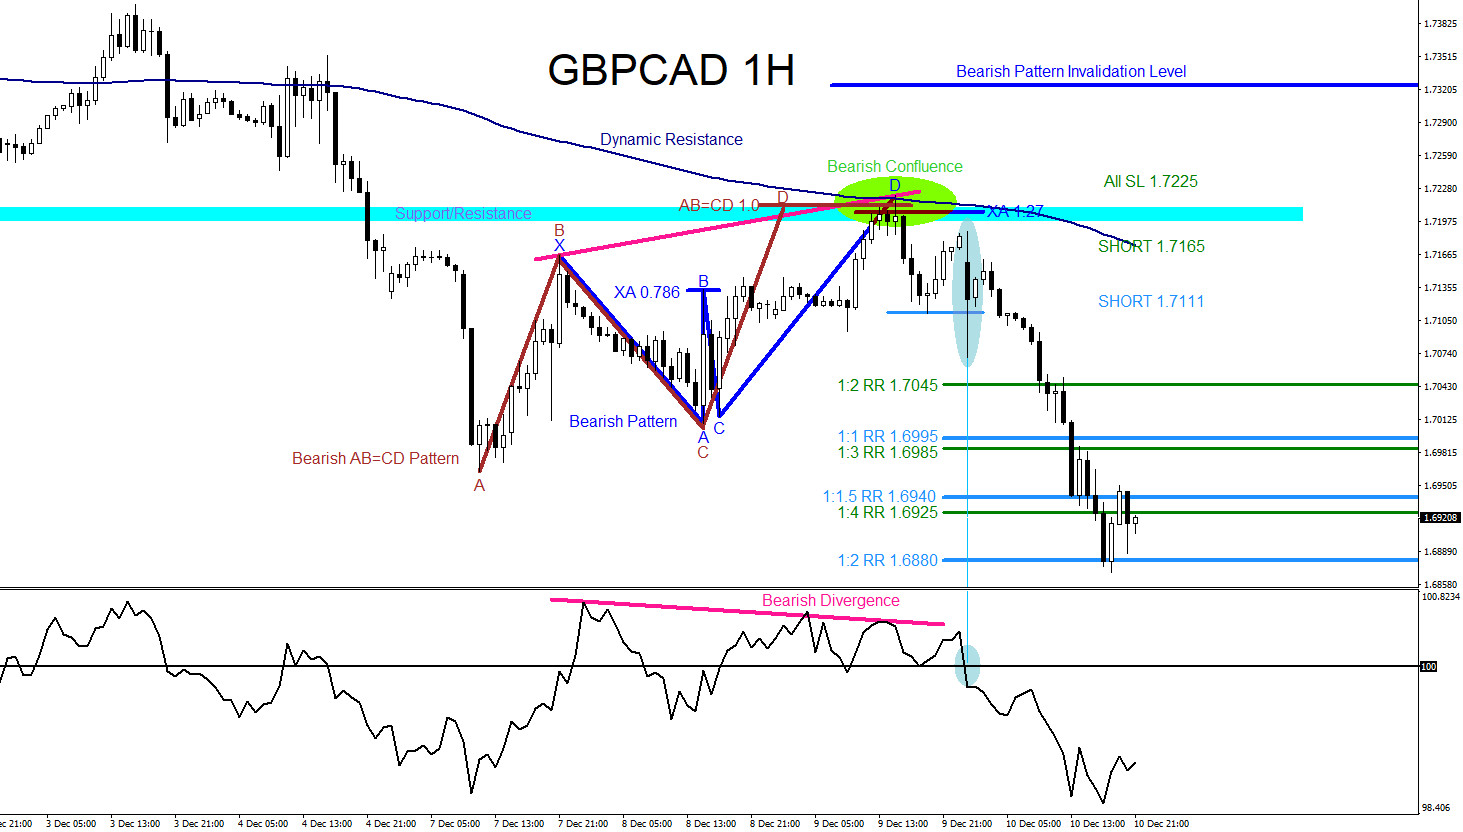
GBPCAD eventually moves lower and on December 10 2020 price hits the 1st SELL entry (green) 1:4 RR target at 1.6925 from 1.7165 for +240 pips and also hit the 2nd SELL entry (light blue) 1:2 RR target at 1.6880 from 1.7111 for +231 pips for a combined +471 pips. If you followed me on social media @AidanFX you too could have caught the GBPCAD move lower. We at EWF never say we are always right. No market service provider can forecast markets with 100% accuracy. Only thing we at EWF 100%, is that we are RIGHT more than we are WRONG.
GBPCAD 1 Hour Chart December 10/2020
Of course, like any strategy/technique, there will be times when the strategy/technique fails so proper money/risk management should always be used on every trade. Hope you enjoyed this article and follow me on social media for updates and questions> @AidanFX
At Elliottwave-Forecast we cover 78 instruments (Forex, Commodities, Indices, Stocks and ETFs) in 4 different time frames and we offer 5 Live Session Webinars everyday. We do Daily Technical Videos, Elliott Wave Trade Setup Videos and we have a 24 Chat Room. Our clients are always in the loop for the next market move.
Source: https://elliottwave-forecast.com/aidans-corner/gbpcad-bearish-patterns-signalling-move-lower/