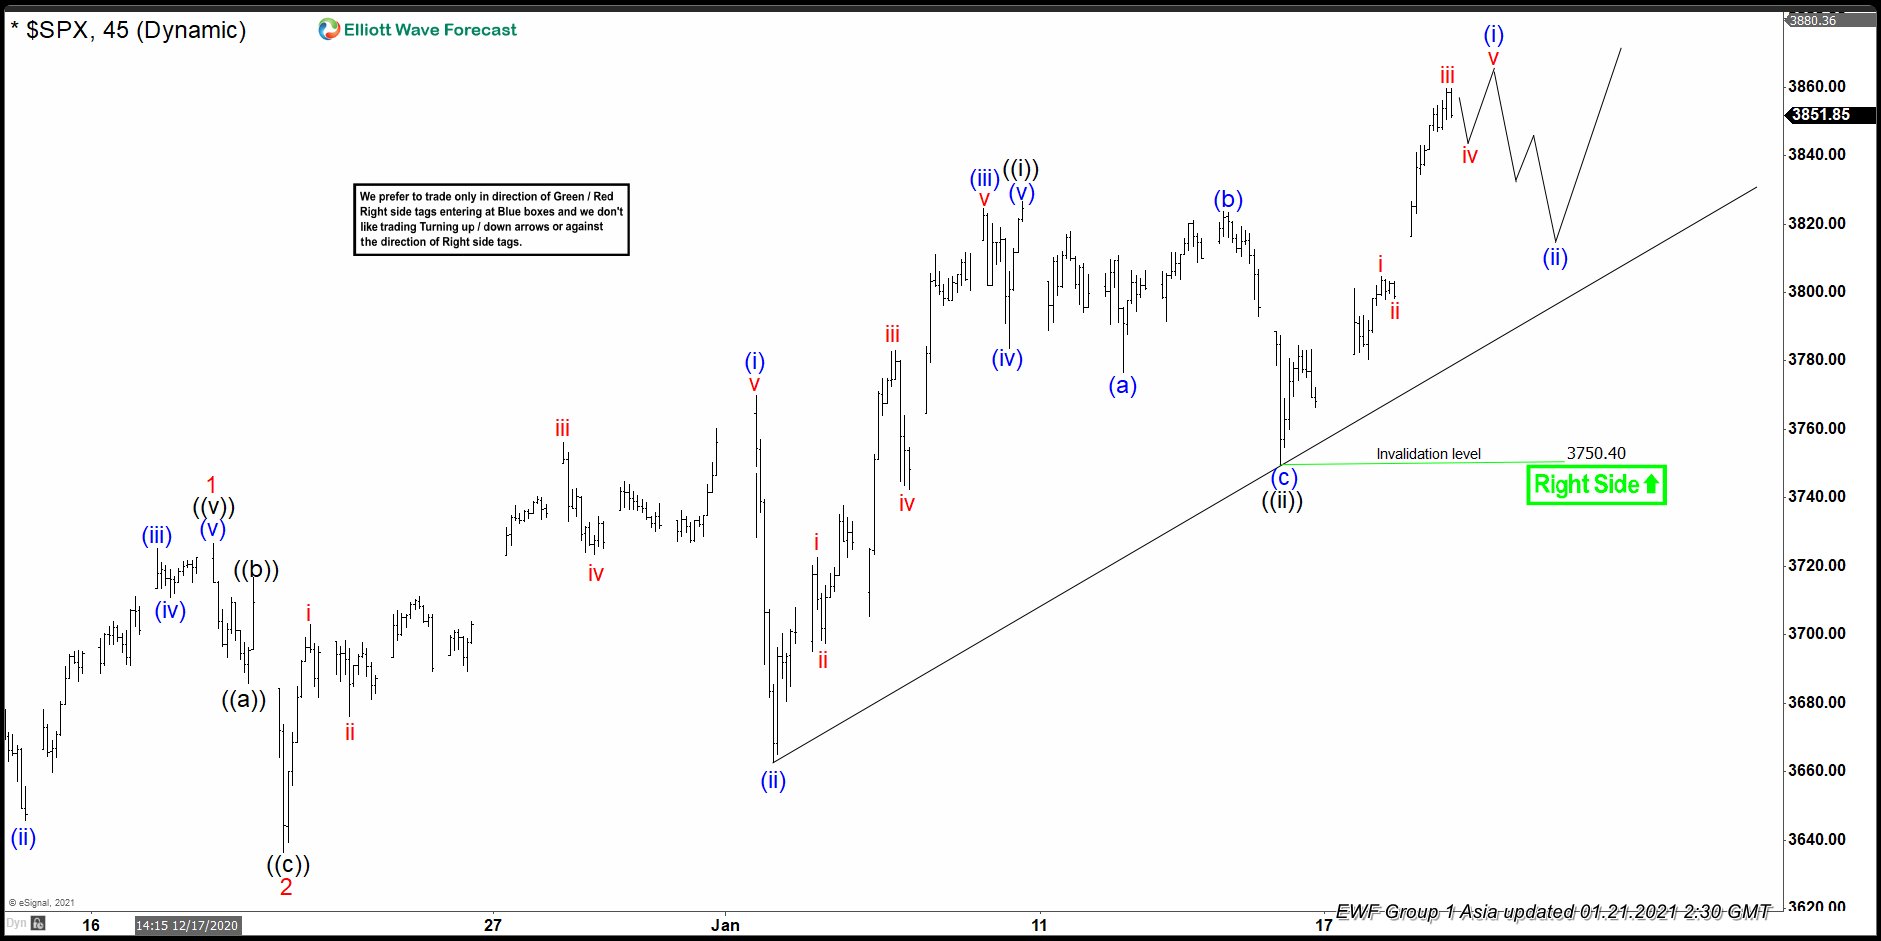
Short Term Elliott Wave view in S&P 500 (SPX) suggests the Index ended wave 1 at 3726.70 and pullback in wave 2 ended at 3636.48. Internal of wave 2 unfolded as a zigzag. Wave ((a)) ended at 3685.84, wave ((b)) ended at 3716.65, and wave ((c)) ended at 3636.48. Index has resumed higher in wave 3 with the internal subdivision as a 5 waves impulse. Up from wave 2 low, wave (i) ended at 3679.99 and dips in wave (ii) ended at 3662.71. Index then resumed higher in wave (iii) towards 3824.40, and pullback in wave (iv) ended at 3783.60. Final leg higher wave (v) ended at 3826.69. This completed wave ((i)) in larger degree.
Wave ((ii)) pullback ended at 3750.40 and the Index has resumed higher again. Up from wave ((ii)), Index rallies in a short term impulsive structure and can see one more high before ending wave (i). It should then pullback in wave (ii) to correct cycle from January 15 low before the rally resumes. As far as wave ((ii)) pivot at 3750.4 stays intact, expect dips to find support in 3, 7, or 11 swing for more upside.
S&P 500 (SPX) 45 Minutes Elliott Wave Chart

Source: https://elliottwave-forecast.com/news/elliottwave-view-spx-upside-move-resumed/
