Hello fellow traders. In this technical blog we’re going to take a quick look at the Elliott Wave charts of Ten Year Notes Futures $ZN_F , published in members area of the website. As our members know, $ZN_F has been showing incomplete bearish sequences within the cycle from the 03.09.2020 peak. Consequently we were calling for more weakness , suggesting members to avoid buying it and keep selling the rallies in 3,7,11 swings whenever get chance. In further text we’re going to explain Elliott Wave Forecast and Trading strategy.
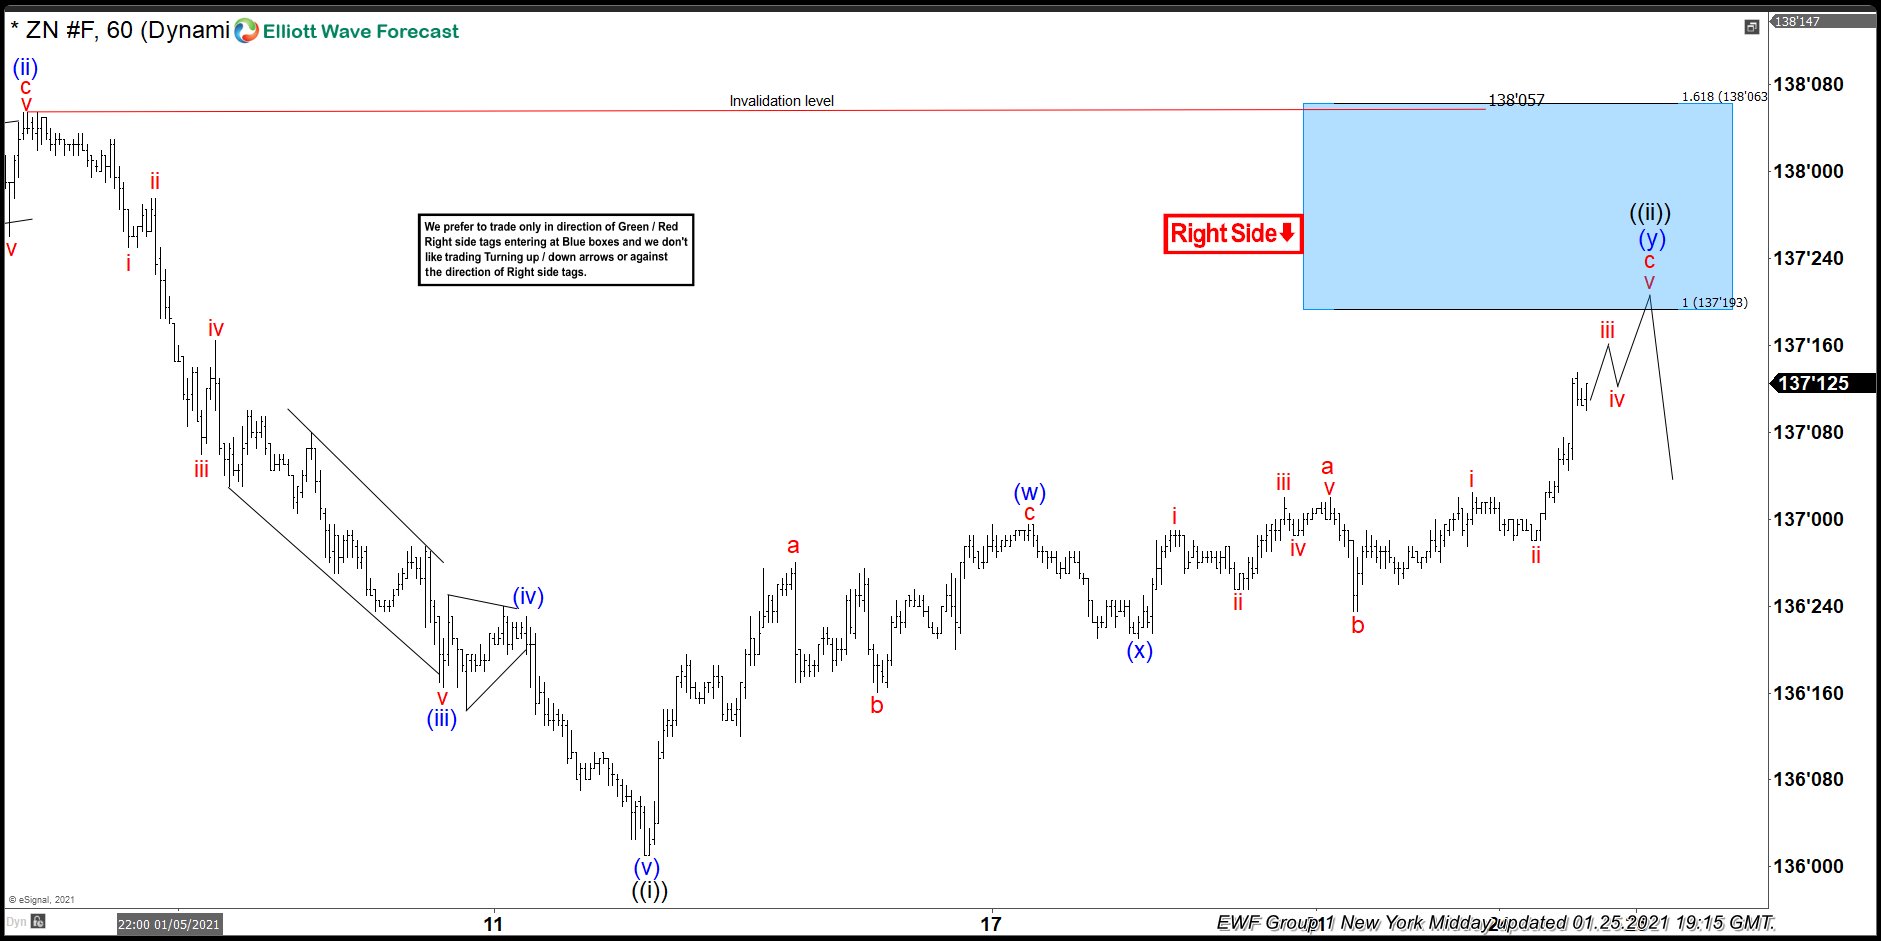
$ZN_F Elliott Wave 1 Hour Chart 1.25.2021
Current view suggests Ten Year Note is correcting the cycle from the 138’08 peak. Recovery is having form of Elliott Wave Double Three Pattern that should ideally complete at 137’19-138’06 area . At the Blue Box area sellers should ideally appear for decline toward new lows ideally. As the main trend is bearish we expect to see at least pull back from the marked zone. Once the price reaches 50 fibs against the (x) blue low, we should make short positions risk free. As our members know Blue Boxes are no enemy areas , giving us 85% chance to get a reaction.
You can learn more about Elliott Wave Patterns at our Free Elliott Wave Educational Web Page.
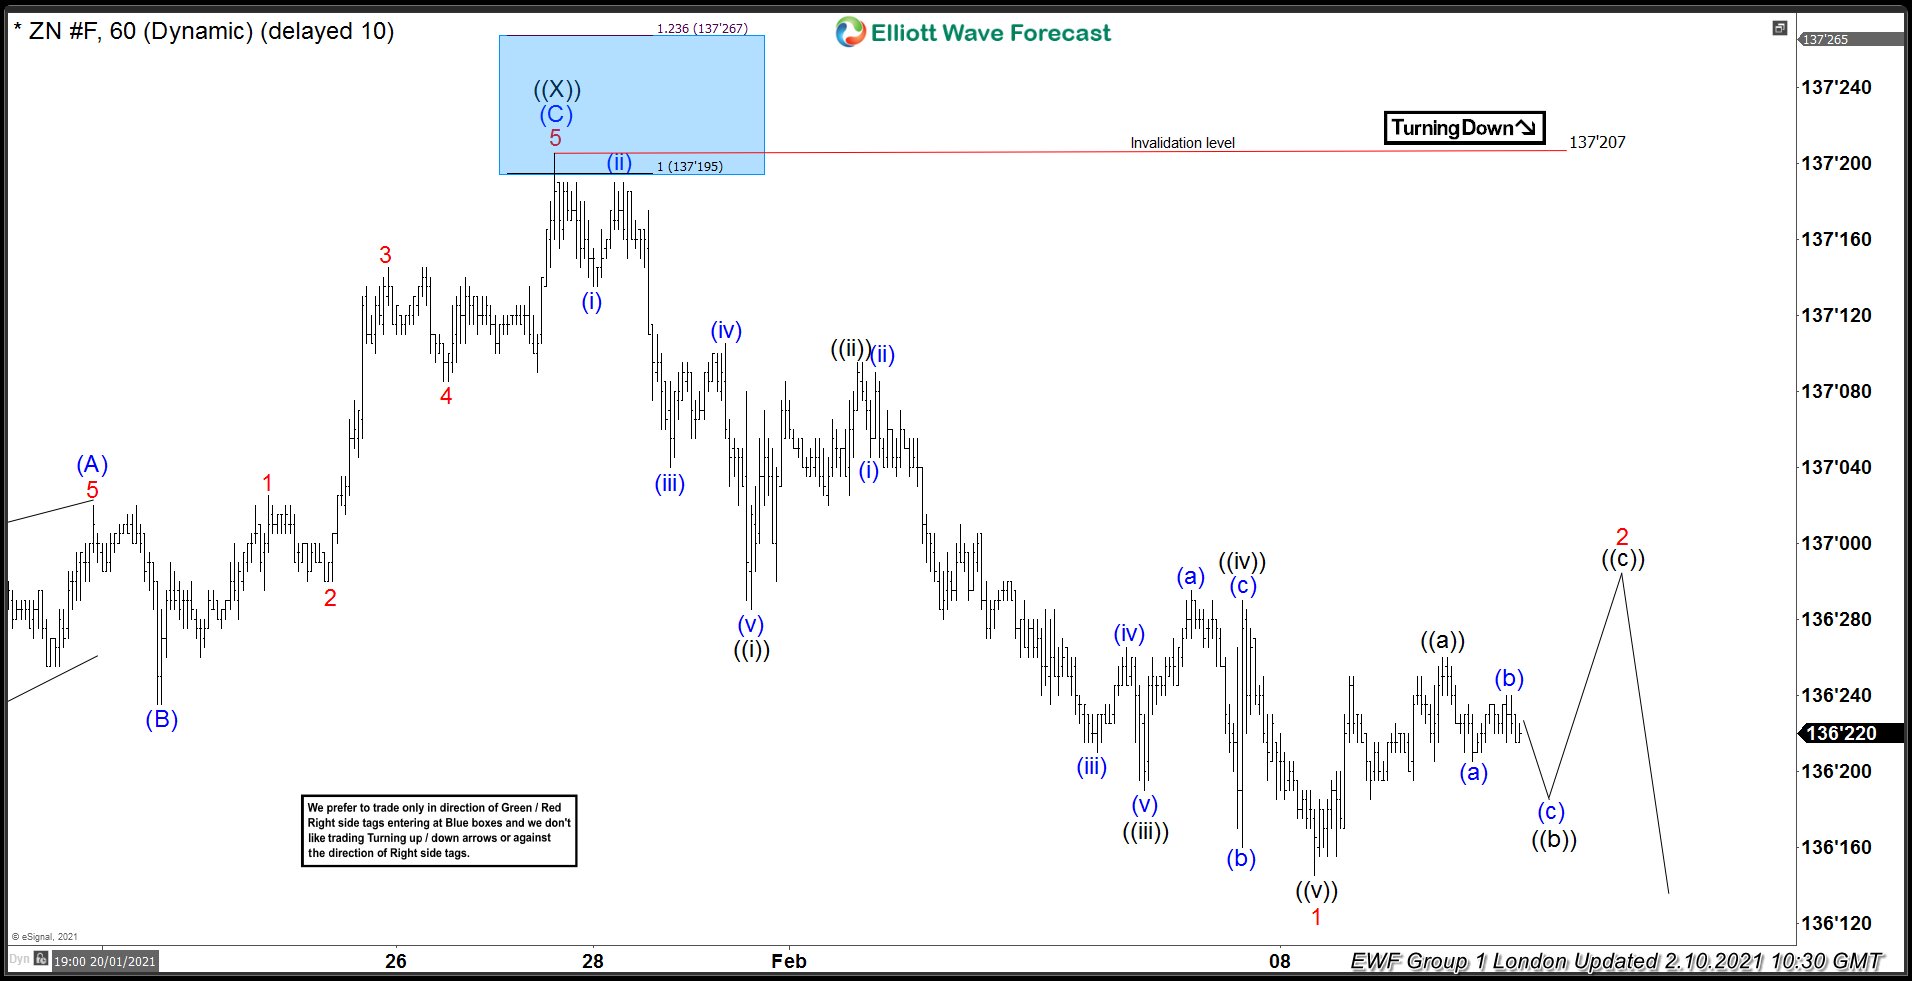
$ZN_F Elliott Wave 1 Hour Chart 2.10.2021
Ten Year Notes found sellers right at the blue box : 137’19-138’06 area. It gave us nice decline from the selling area. At the moment the price has already reached 50 fibs against the connector low. Members who sold the $ZN_F at the blue box area now enjoying profits in a risk free trades. Current view suggests the decline from the 137’2 peak ended as 5 waves and now we are getting 2 red recovery. Once proposed recovery completes we expect to see further weakness. Ten Year Notes is targeting 133’08 area, according to Daily chart. We don’t recommend buying it at this stage, and favor staying in risk free short positions from the blue box area.
Source: https://elliottwave-forecast.com/trading/ten-year-notes-zn_f-decline-blue-box/


