In this blog, we look at how Russell (RTY_F) reacted higher from the blue box
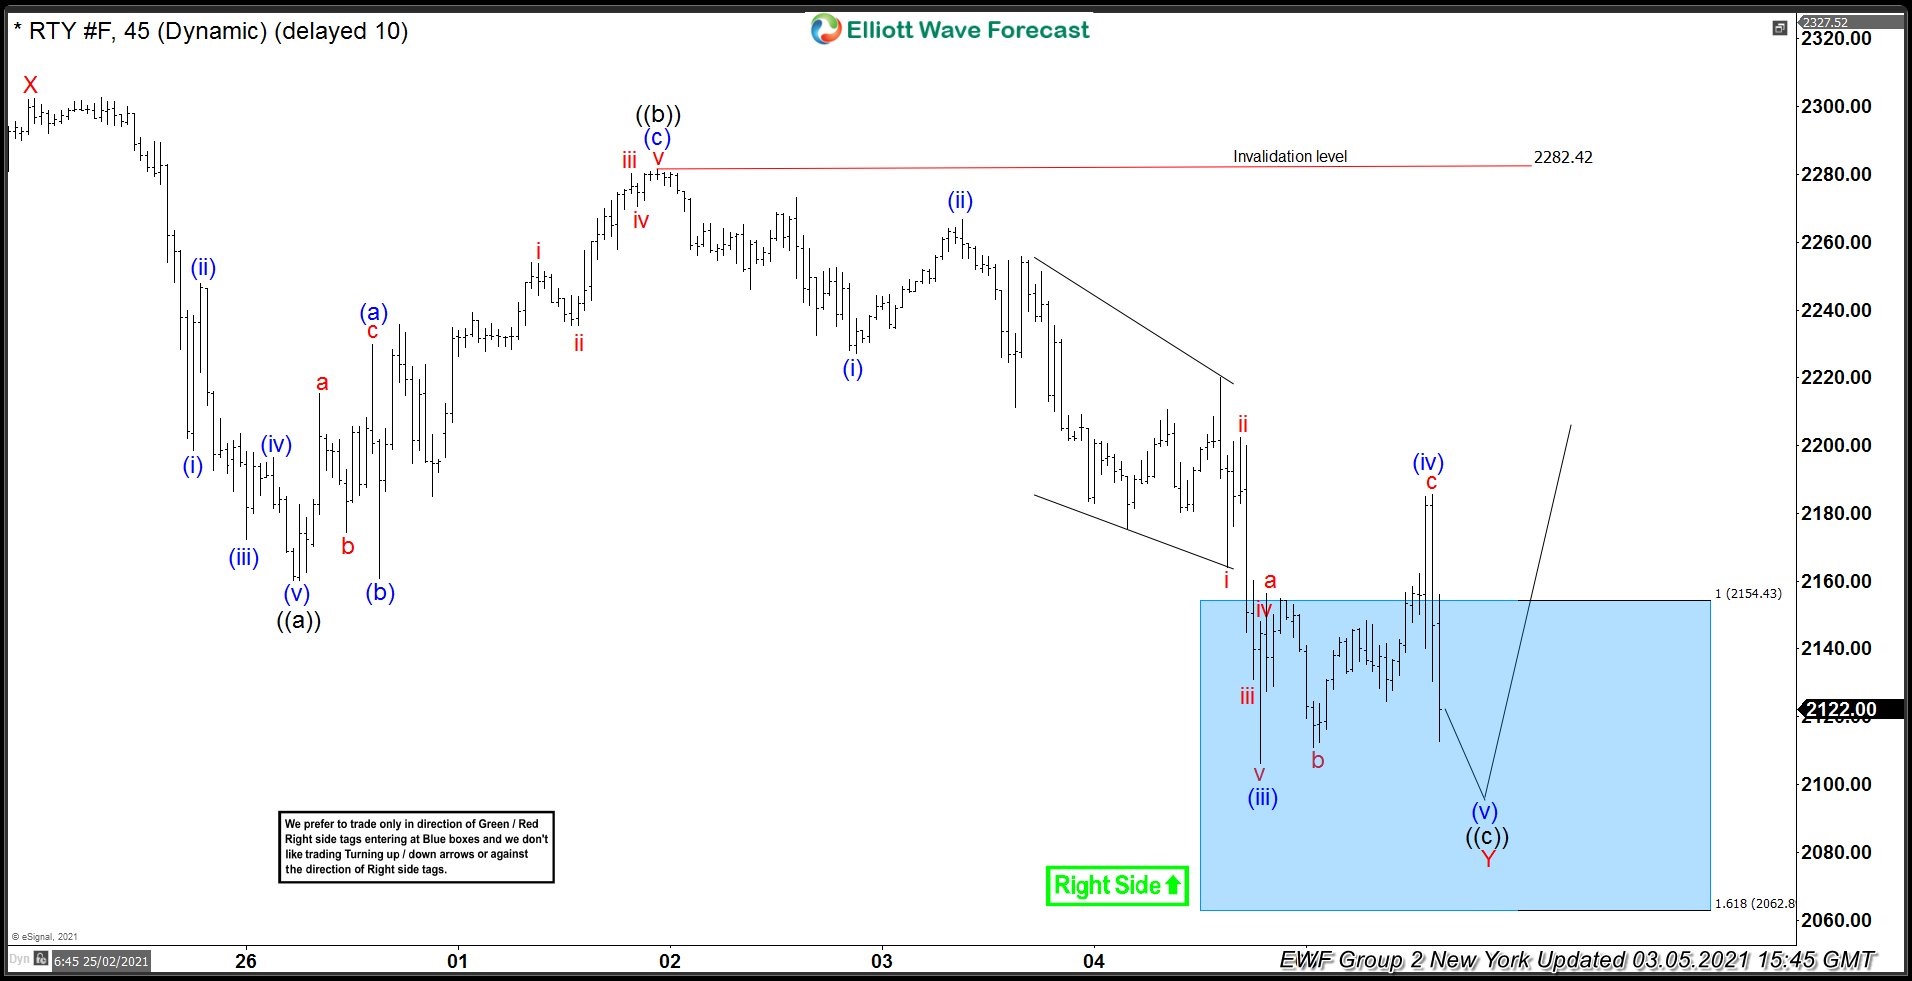
The 1 hourly chart below is from 3/5/2021 New York update. In it, we see Russell already in the blue box. As per our strategy, we expected a reaction and a separation higher from there. Our view would be invalidated if price went below 2062.8. The decline from red wave X unfolded as a zig zag in red wave Y.
Internals of red wave Y are subdivided into two impulses ((a)) and ((c)). These two impulses were connected by connector wave ((b)). In some instances, Wave ((c)) can unfold as an ending diagonal . Because waves ((a)) and ((c)) were impulse waves themselves, each have impulse waves subdivisions. The right side is upside against 2062.8, and we prefer to buy Russell in 3, 7 or 11 swings looking for more upside.
ElliottWave 1 hourly chart from 3/5/2021

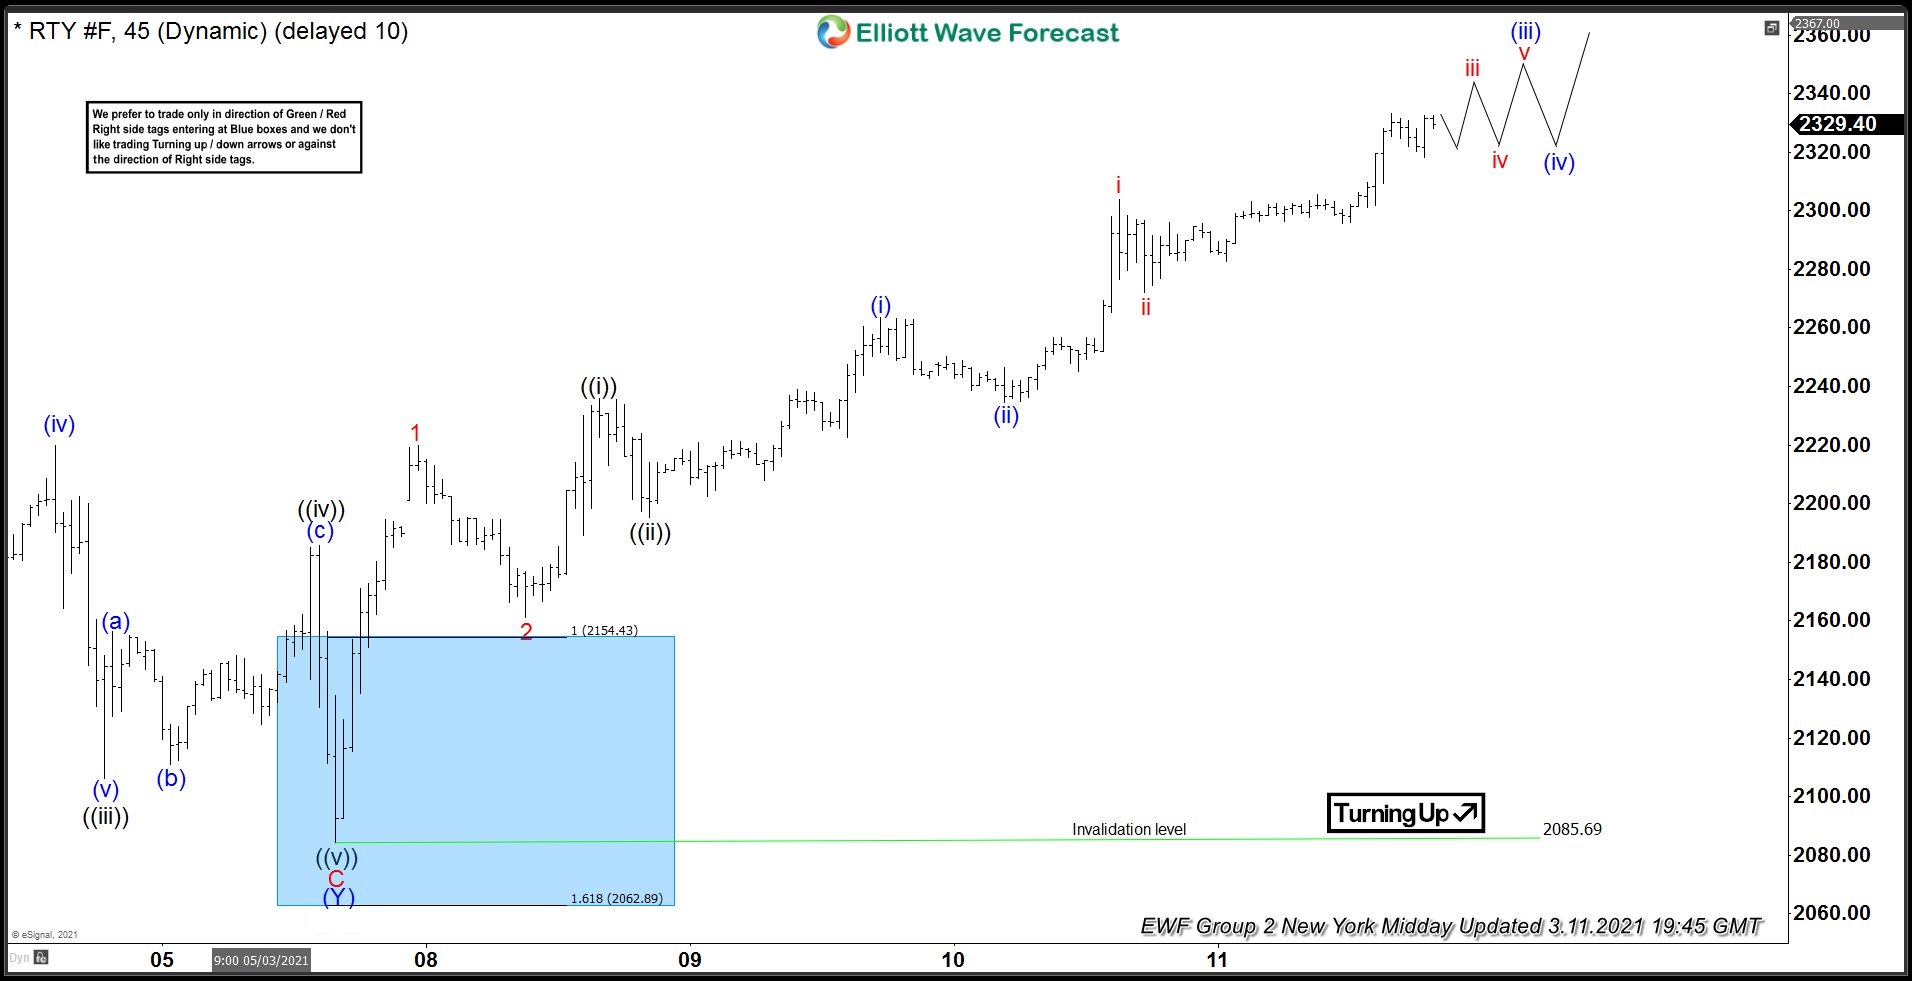
In the 1 hour chart below, we see a reaction higher from the blue box as per forecast. We expected the reaction to complete an impulse in the intermediate degree. The chart shows red wave 1 completed, with a pull back in 2 also called completed. From the wave 2 lows, we see a futher rally in wave 3, although the bullish sequence appeared incomplete. As far as it is above 2085.6, we favor more upside. However, the market does not move linearly. Therefore we will expect pull backs during the upside advance. And we will be looking to buy the aforementined pull backs in 3, 7 or 11 swings.
ElliottWave 1 hourly chart from 3/11/2021

Our blue box system is a very effective system that we, and our members use to enter trades. We offer analysis on 78 different instruments, 3 live trading room sessions per day. We also provide regular updates on all 78 instruments.
Source: https://elliottwave-forecast.com/stock-market/russell-reacts-higher/

