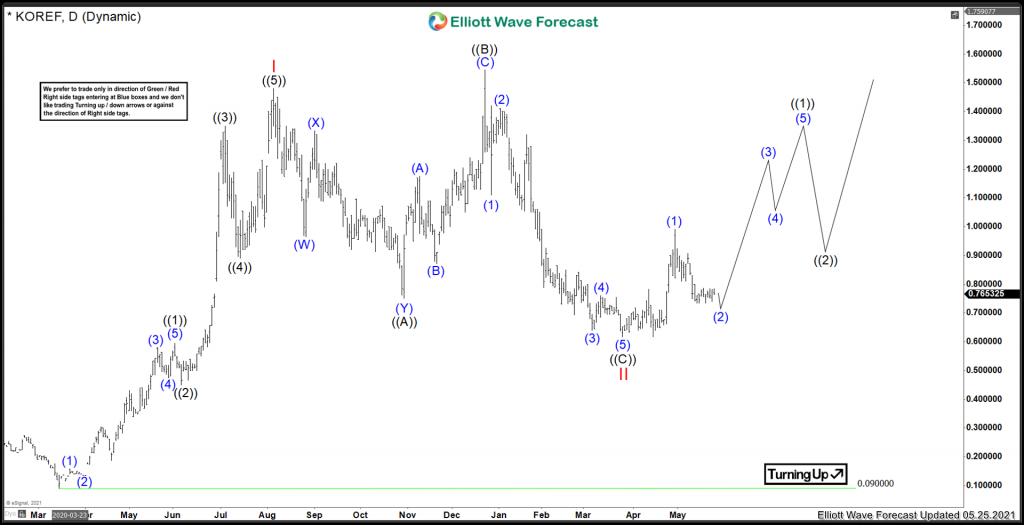
The Metals sector has been slowly coming back since the lows in late 2015 and is ready for prime time attention after Gold made new all time highs in August 2020. Kore Mining Ltd. is a gold exploration company. As such, has a very volatile chart but overall, follows the Gold spot market fairly close. Lets take a look at the company profile:
“KORE Mining Ltd is 100% owner of two advanced gold exploration and development assets in California, USA – Imperial and Long Valley. It is supported by strategic investor Eric Sprott (26% ownership), who alongside KORE management and Board (38% owners), are aligned with shareholders in creating per share value. KORE is preparing its Imperial Gold project for mine permitting while also aggressively exploring the two district scale claim areas at the Imperial and Long Valley gold projects.”
We are going to take a look at chart on OTC market since setting the low in March 2020. The OTC ticker is $KOREF and the the Canadian Symbol is $KORE which is listed on the CVE in Canada.
Kore Elliottwave View:

Since the March 2020 lows, the count in Kore is showing a clear impulsive structure into the August 2020 peak. Red I is favoured to have set at 1.48 on August the 5th.. After that, Red II has taken shape as an expanded flat correction. This is a correction in which the B wave travels higher than the initial peak in Red I. After ((B) was set on Dec 22/2020, ((C)) of Red II took shape as an impulse lower. Red II is favoured to have set a low at 0.617. Currently prices are favoured to be pulling back in (2) blue before moving higher.
Source: https://elliottwave-forecast.com/stock-market/kore-mining-ltd-koref-kore-ready-upside/

