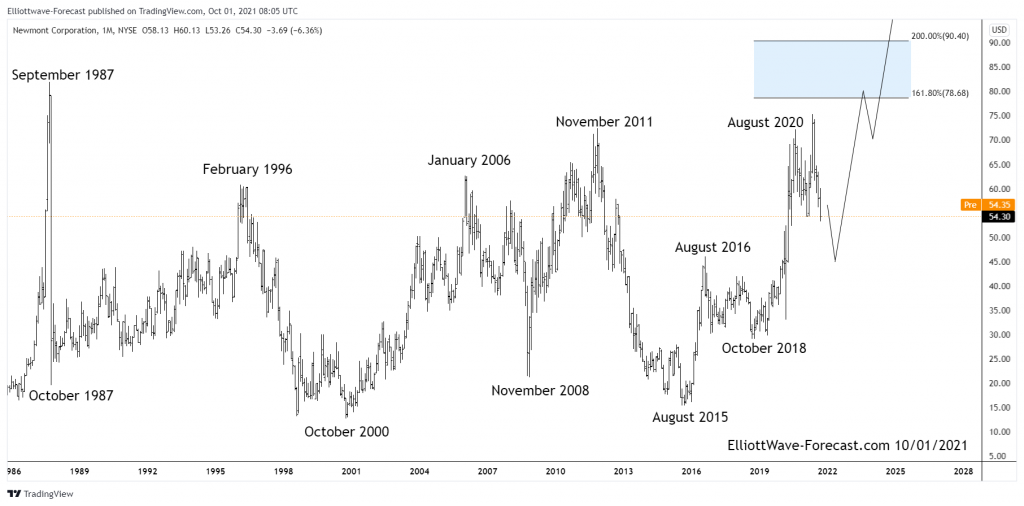
$NEM Longer Term Bullish Cycles of The Newmont Corporation
Firstly from the beginning of price data from back in the 1970’s not shown on the chart, the price trend was obviously up. It ended that bullish cycle in September 1987 and pulled back really hard during the October 1987 crash. Price stabilized from there several years into the 1996 highs before another cycle lower into the October 2000 lows. That swing lower finished a correction of the cycle up from the all time lows. Those lows are still intact. The bounce that developed from the October 2000 lows into the January 2006 highs appears to have been an Elliott Wave impulse of five waves.
Secondly the three large swings from the January 2006 highs down to November 2008 lows appears to be the beginning of a large flat 3-3-5 structure. From the November 2008 lows back up to the November 2011 highs was likely a zig-zag structure by itself. The decline from the November 2011 highs down to the August 2015 lows appeared to be five waves. This completed a 3-3-5 flat structure. Of note, the lows from October 2000 remained intact again suggesting the August 2015 lows finished correcting that cycle up from there.
The analysis continues below the chart.

Thirdly in conclusion the aforementioned lows from August 2015 & now as well as the October 2018 lows should remain intact during future pullbacks for a long time to come. The bounce from those lows definitely ended the cycle lower. The bounce to the August 2016 high appeared to be five waves up. This was similar to the October 2000 to January 2006 bounce although of smaller degree. The pullback lower from the August 2016 high to the October 2018 low was obviously three swings. Price has bounced real hard from there suggesting it is within a larger degree wave three. Pullbacks should remain well above the October 2018 cycle lows. While doing that, the possibility remains that current cycle will take out the old highs from September 1987 in the not too distant future.
