Snap Inc. is an American camera and social media company, founded on September 16, 2011, by Evan Spiegel, Bobby Murphy, and Reggie Brown based in Santa Monica, California. The company developed and maintained technological products and services, namely Snapchat, Spectacles, and Bitmoji.
SNAP Daily Chart

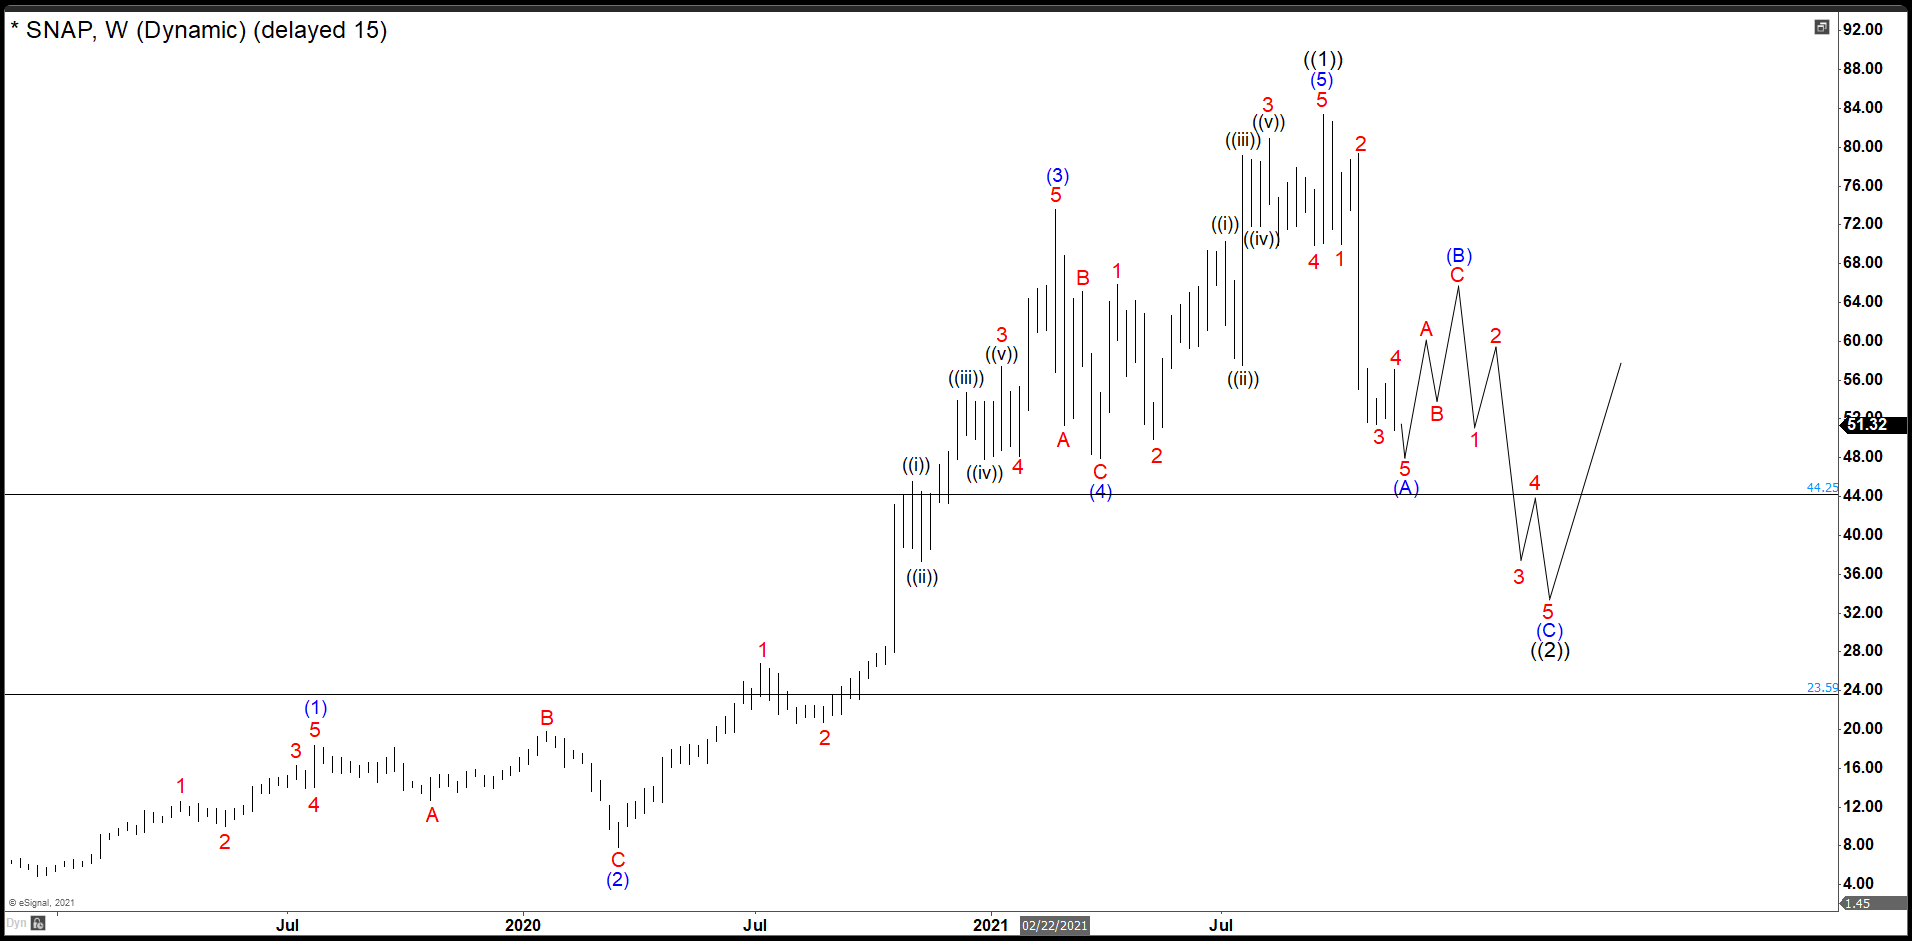
The market cycle began on December 2018 when SNAP found support at $4.82 american dollars. The stock got a bullish momentum and built a motive wave ending near to $84.0, getting more than 900% of return in two and half years. The wave (1) of the impulse ended at $18.36. The pullback made an irregular flat completing at $7.89 as wave 2. Wave (3) started a powerful rally reaching $73.59 in less than a year. Wave (4) correction drop to 38.2% Fibonacci retracement from wave (2) at $47.92 and the last rally to complete wave (5) and the impulse wave ((1)) finished at $83.34. (If you want to learn more about Elliott Wave Theory, please follow these links: Elliott Wave Education and Elliott Wave Theory).
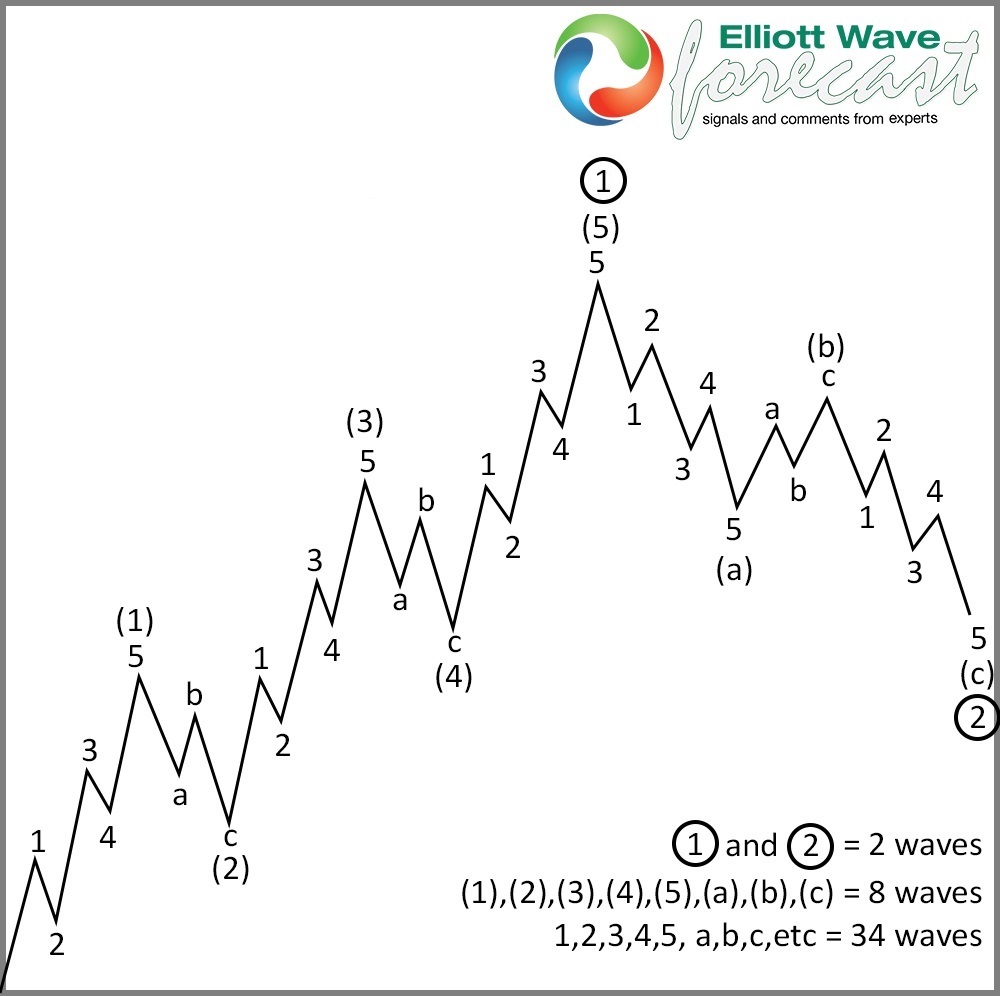
Elliott Wave Theory Motive Wave Structure

SNAP Correction and Target
From the peak, SNAP already has 5 swings down and appears the structure is not finished yet to end wave (A). Therefore, we should see more downside in the next days. After completing this wave (A), we should bounce in at least 3 swings or 7 swings to correct the drop from the top and that movement we will call wave (B). Then we should resume the downtrend looking for another 5 swings down to repeat the fractal of wave (A), finishing an (A) (B) (C) correction as wave ((2)) and then the stock should find buyers for a new rally. We expect that this correction will end in $44.25 – $23.59 area and we are going to be updating to look for the best entry in this one.
Source: https://elliottwave-forecast.com/stock-market/snap-closed-cycle-2018-correction-mode/

