S&P BSE Sensex Index Long Term Bullish Cycles & Elliott Wave
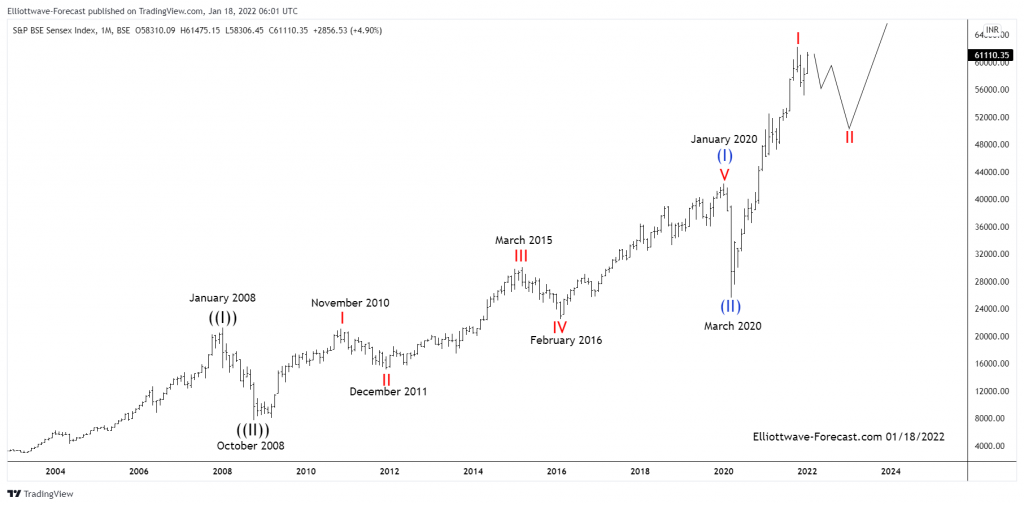
The Sensex Index has been trending higher with other world indices. Firstly in it’s base year 1978 to 1979 the index’s point value was set at 100. From there it rallied with other world indices trending higher into the January 2008 highs. It then corrected the bullish cycle as did most other world indices. Furthermore it ended that larger degree correction in October 2008. From those 2008 lows, the index shows a bullish sequence that favors further upside.
Secondly there was a less bullish alternative Elliott Wave count that had a target extension at 46844. This is where a larger black ((I)) could have ended. However price has since went way past there invalidating the thought putting it more in line with other world indices. In this case the Fibonacci extension is measured is as follows. Take a Fibonacci extension tool on a charting platform. Point 1 will be at zero a hypothetical beginning. Point 2 is at the January 2008 cycle high. From there on up to the March 2020 lows will be the point 3. This gives a Fibonacci extension area fifth wave target where the fifth wave would be equal to the wave one where a larger ((I)) could have ended.
As price exceeded the area suggested in that view the momentum indicators also began suggesting this is a huge bullish nested series of wave one’s and two’s. The preferred analysis continues below the chart.
Sensex Index Monthly Chart

In conclusion the currently favored view in the Sensex index is as shown. It’s showing a nested Elliott Wave bullish cycle. It is in a larger wave ((III)) higher. From the 2008 lows there is a clear five waves up into the January 2020 highs as subdivided on the chart. The pullback in wave (II) into the March 2020 lows was very fast in time however while price is above the March 2020 lows the index should trade higher.

