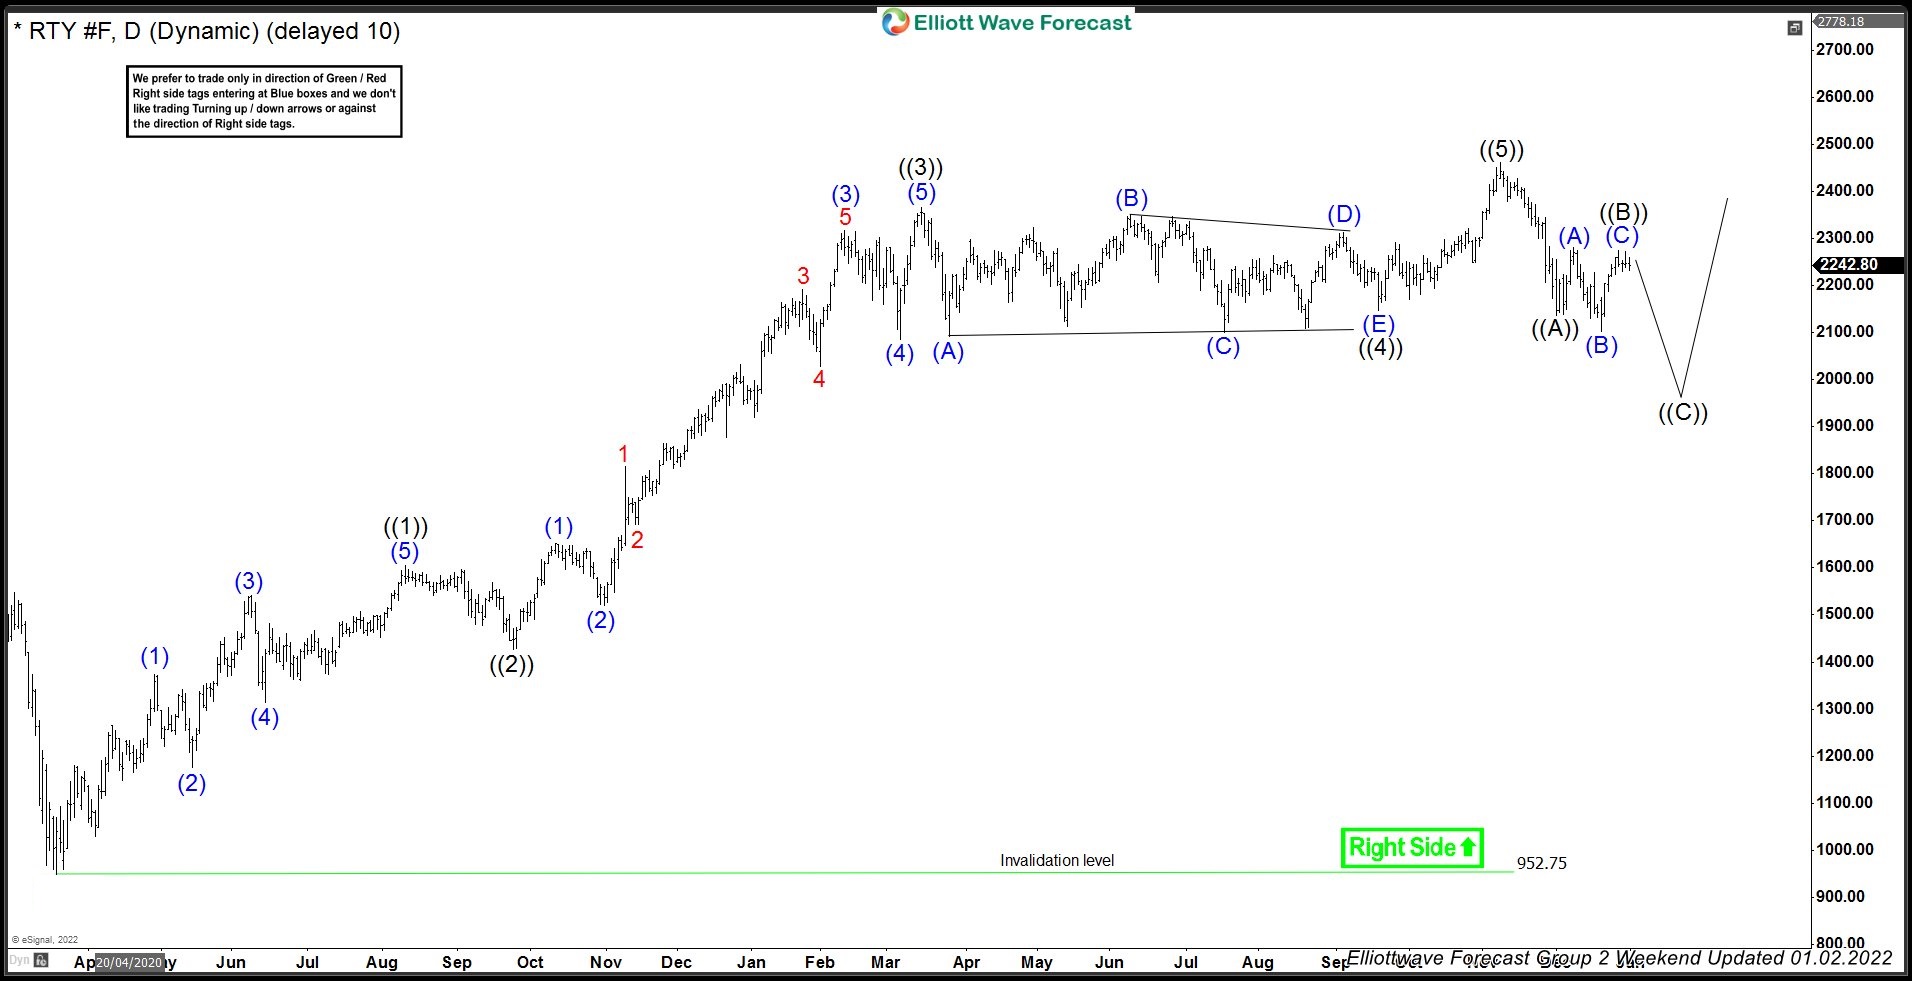
RTY_F made a sharp decline during the month of January 2022. Clients of Elliottwave-Forecast were aware that decline was nothing more than another buying opportunity and our daily chart had the range defined where we expected 3 waves decline to end and buyers to appear to resume the rally or produce 3 waves reaction higher at least.
RTY_F Daily Chart Elliott Wave Analysis: 2 January, 2022
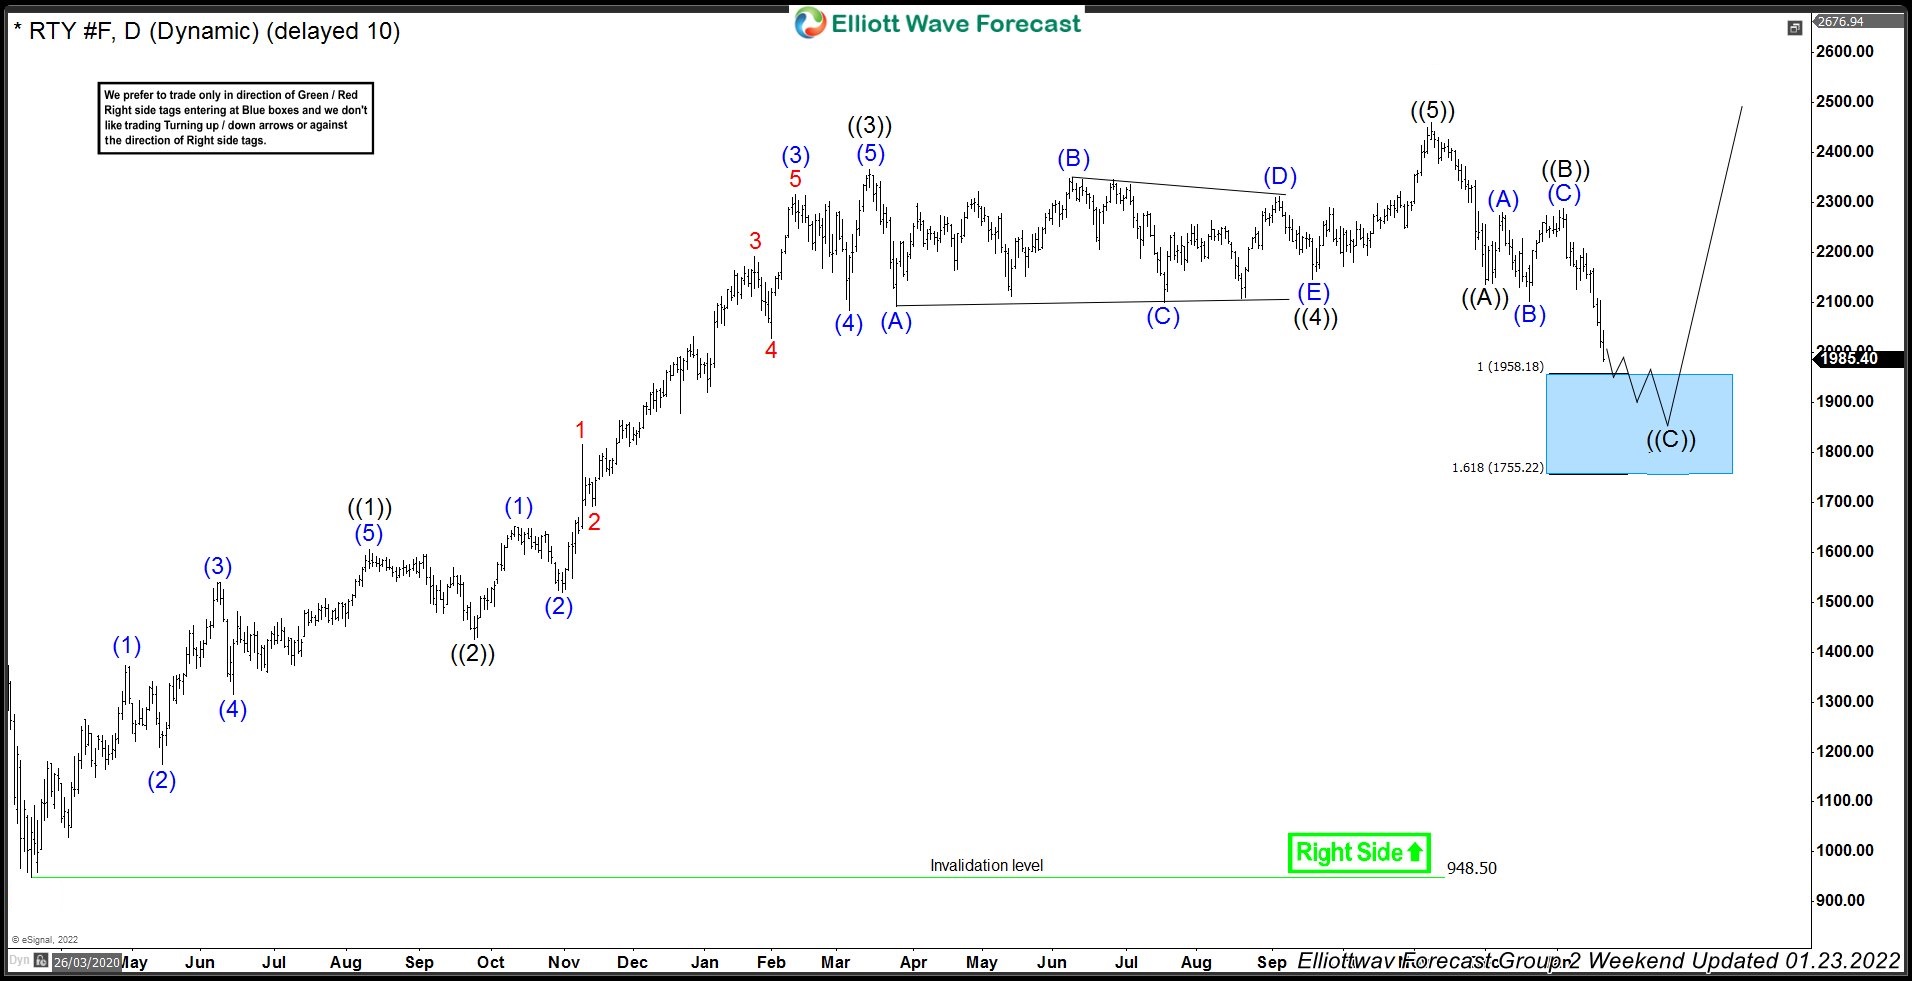
RTY_F Daily Chart Elliott Wave Analysis: 23 January, 2022
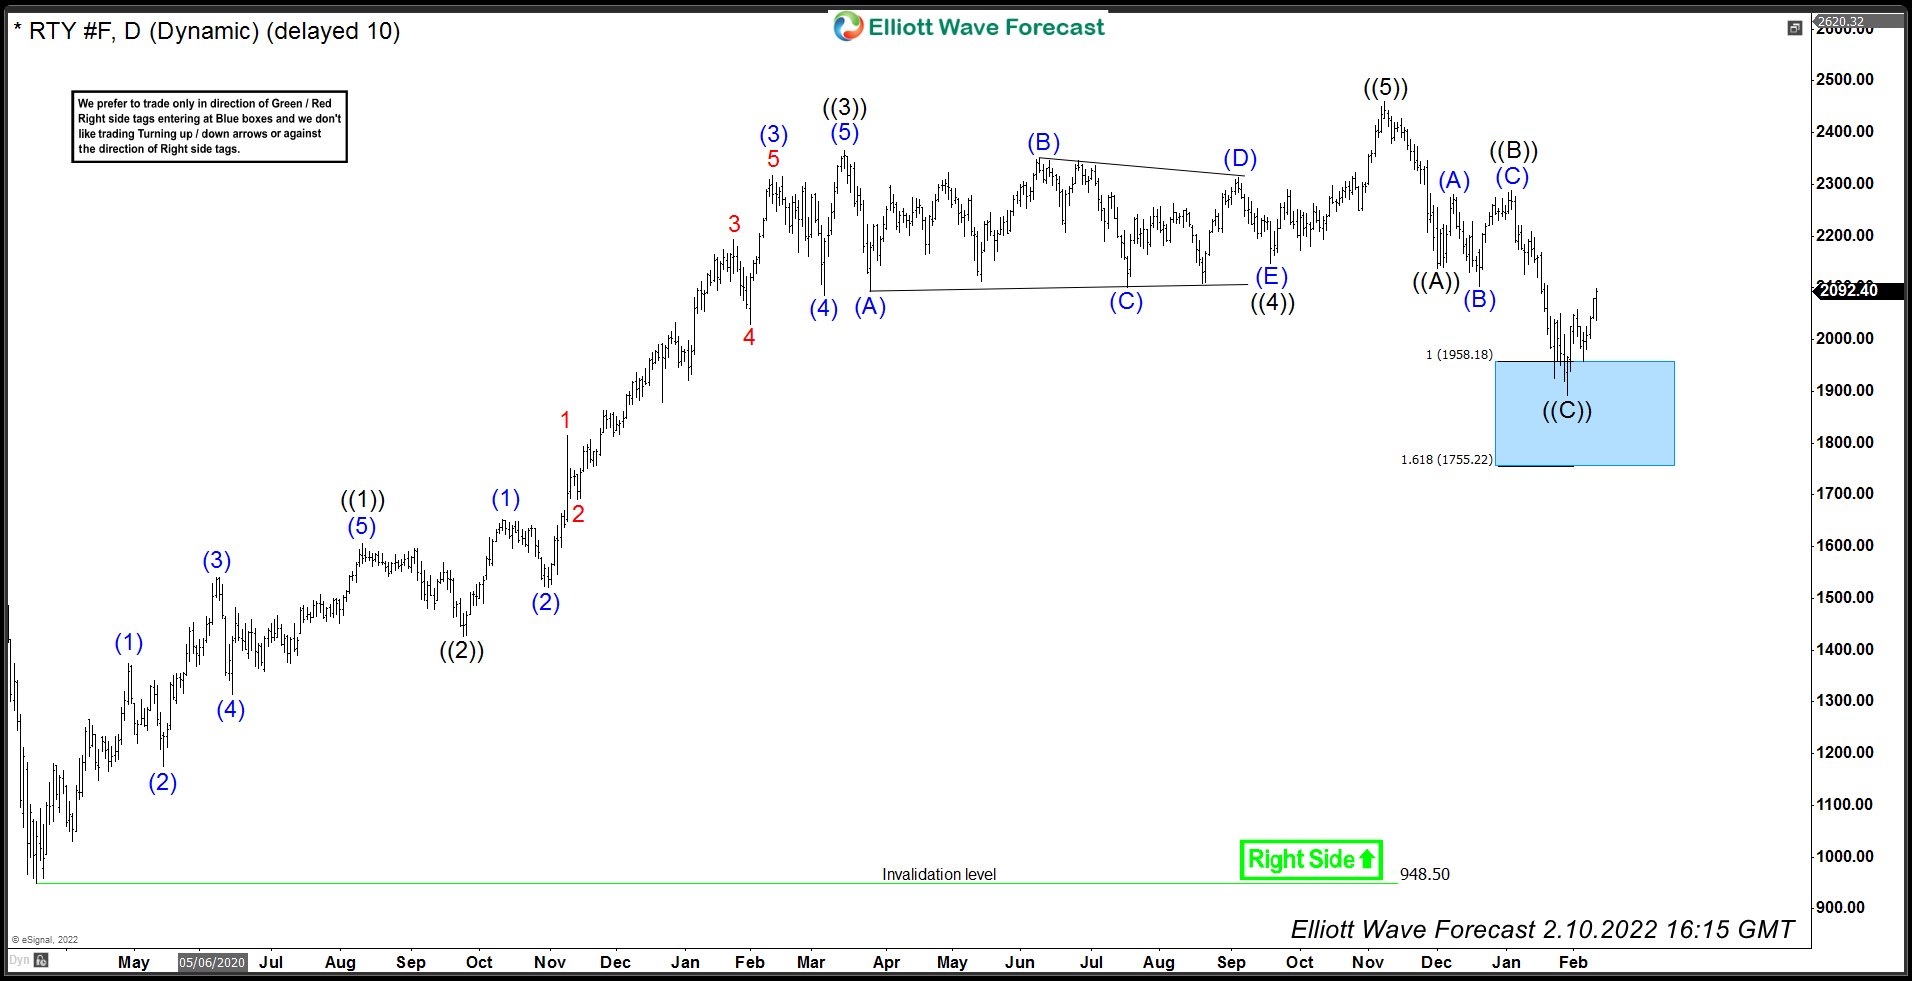
RTY_F Daily Chart Elliott Wave Analysis: 10 February, 2022
Source: https://elliottwave-forecast.com/stock-market/rty_f-forecasting-blue-box-reaction/