Long Term Cycles & Elliott Wave Analysis $FXF
Firstly there is data back to when the ETF fund began in 2006 as low as 78.43. Data correlated in the USDCHF foreign exchange pair suggests the FXF high in August 2011 is also the lows of a cycle lower from the all time in the USDCHF. In this instrument there is data available back to 1971 when the exchange rate was 4.3180.
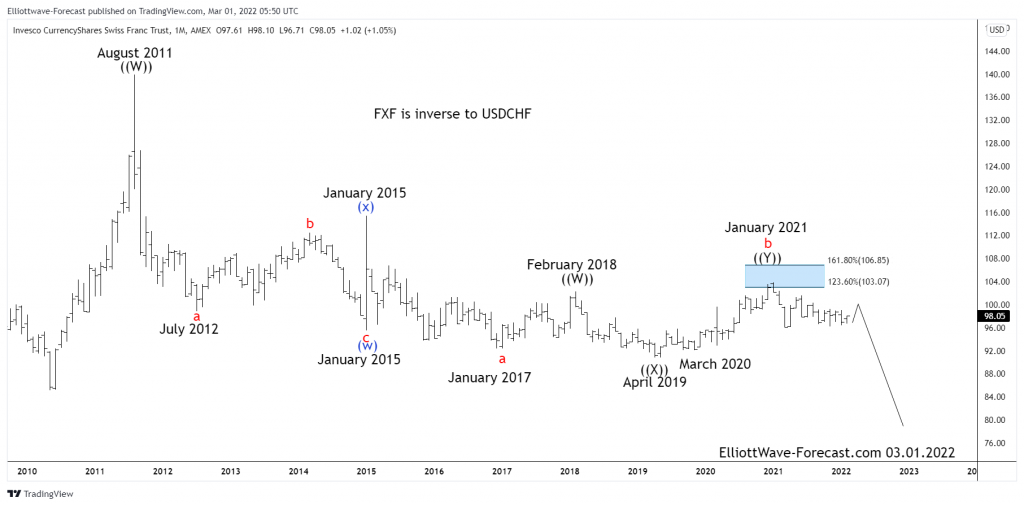
The FXF instrument reflects the price swings of the currency pretty well since inception and as previously mentioned the instrument made a high in August 2011. This where the analysis begins on the monthly chart shown below. The correction from those highs appears to be a an Elliott Wave double three structure. The analysis continues below the monthly chart.

Secondly, as earlier mentioned the decline from the August 2011 highs appears to be an Elliott Wave double three structure. In the second swing of a double three Elliott Wave structure, it generally will reach a price where it is equal to the first swing. When a cycle ends it will show in momentum indicators usually before price makes it obvious. These cycle highs and lows are in the blue color as shown on the chart above (w)-(x). The correction of the January 2015 cycle ended January 2021 in wave b (red). While a bounce remains below there it can see the 70.95 area before a larger bounce higher.
I will mention how this target area lower is obtained in conclusion. Take a Fibonacci extension tool on your chart platform. Beginning at the August 2011 highs as point 1, trace down to the January 2015 lows where the blue (w) is for point 2. Now trace back up to January 2015 blue wave (x) highs for point 3. This will give the equal legs area for (y) (not shown) at 70.95.
Source: https://elliottwave-forecast.com/stock-market/long-term-cycles-elliott-wave-analysis-fxf/
