In this article, we will look at the decline in LTCUSD from $132 to $90 which took almost a week to unfold. We will look at some Elliott wave charts presented to members and show how our members were prepared for this decline in Litecoin. We called a zigzag Elliott wave correction completed in Litecoin (LTCUSD) at $143.93 and called for the decline to resume. Let’s take a look at the chart from February 16, 2022 to begin with.
LTCUSD 1 Hour Elliott Wave Analysis – 16 February, 2022
Chart below shows wave (( i )) and (( ii )) completed and we expected the decline to resume in wave (( iii )) as far as prices stayed below wave (( ii )) high and more importantly below $143.93 high.
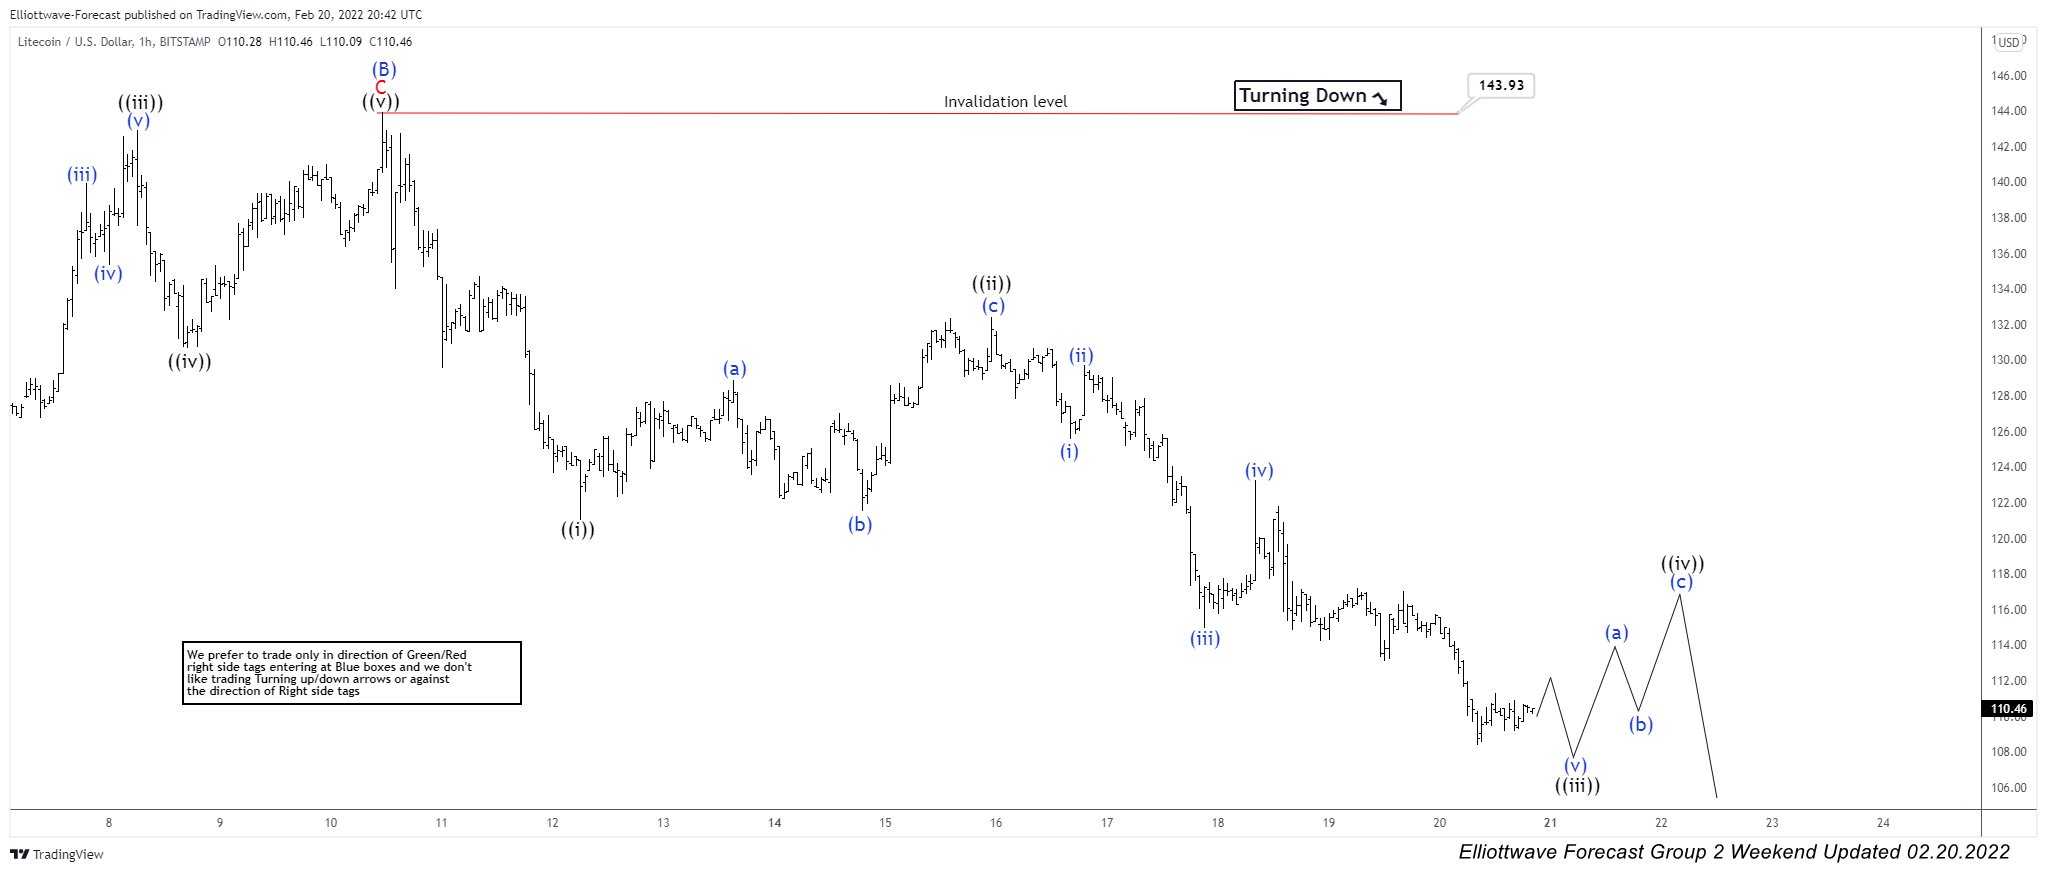
LTCUSD 1 Hour Elliott Wave Analysis – 20 February, 2022
Chart below shows decline resumed as expected and wave (( iii )) is nearing completion after which we expected a bounce in wave (( iv )) and another leg down to complete 5 waves decline from $143.93 high.

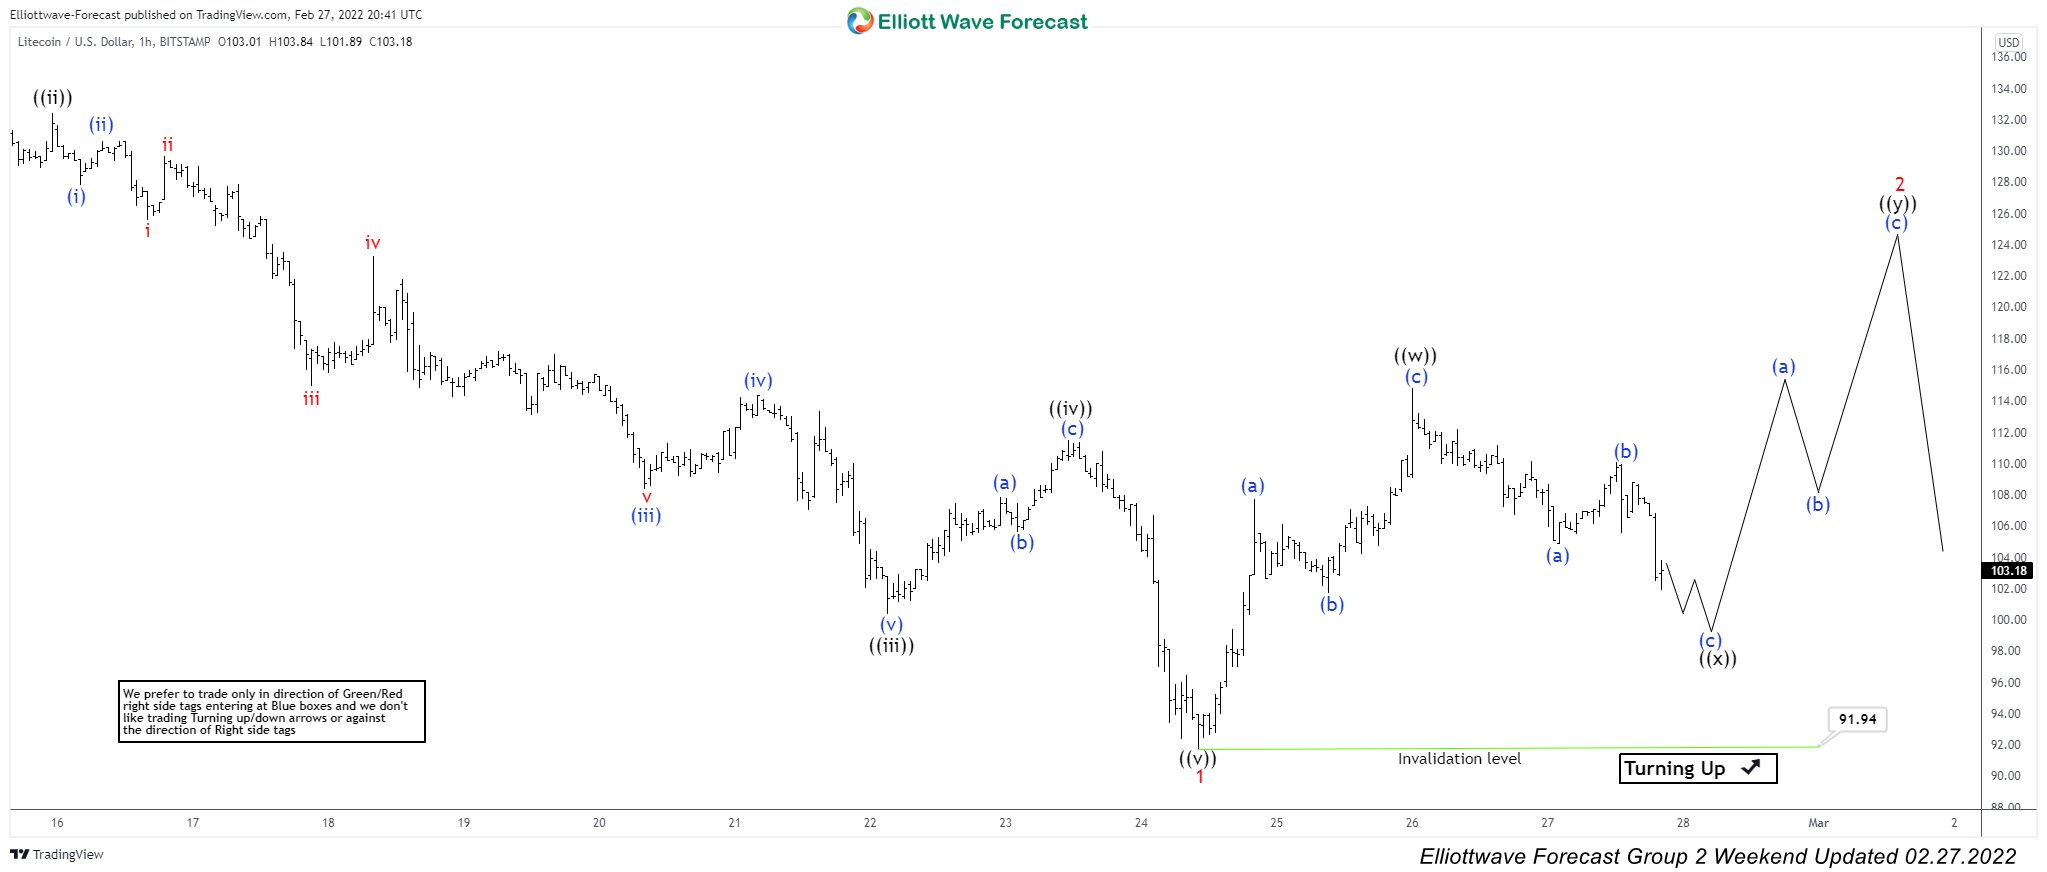
LTCUSD 1 Hour Elliott Wave Analysis – 27 February, 2022
Chart below shows Impulsive decline from wave (B) $143.93 high completed at $91.94 and as dips stay above this level, expect prices to extend higher to complete wave 2 before a turn lower again.

Source: https://elliottwave-forecast.com/forex/litecoin-ltcusd-forecasting-the-decline-using-elliott-wave/

