In this blog, we will take a look at the recent rally in Nasdaq Futures up from May 20, 2022 low, structure of this rally and some charts from the recent past showing our forecast calling for a new high to complete the sequence before starting a pull back. We will then look at how the move unfolded going forward and what we are expecting next. Before we start the blog, we will explain Impulse Elliott Wave Structures.
Elliott Wave Impulse Structure
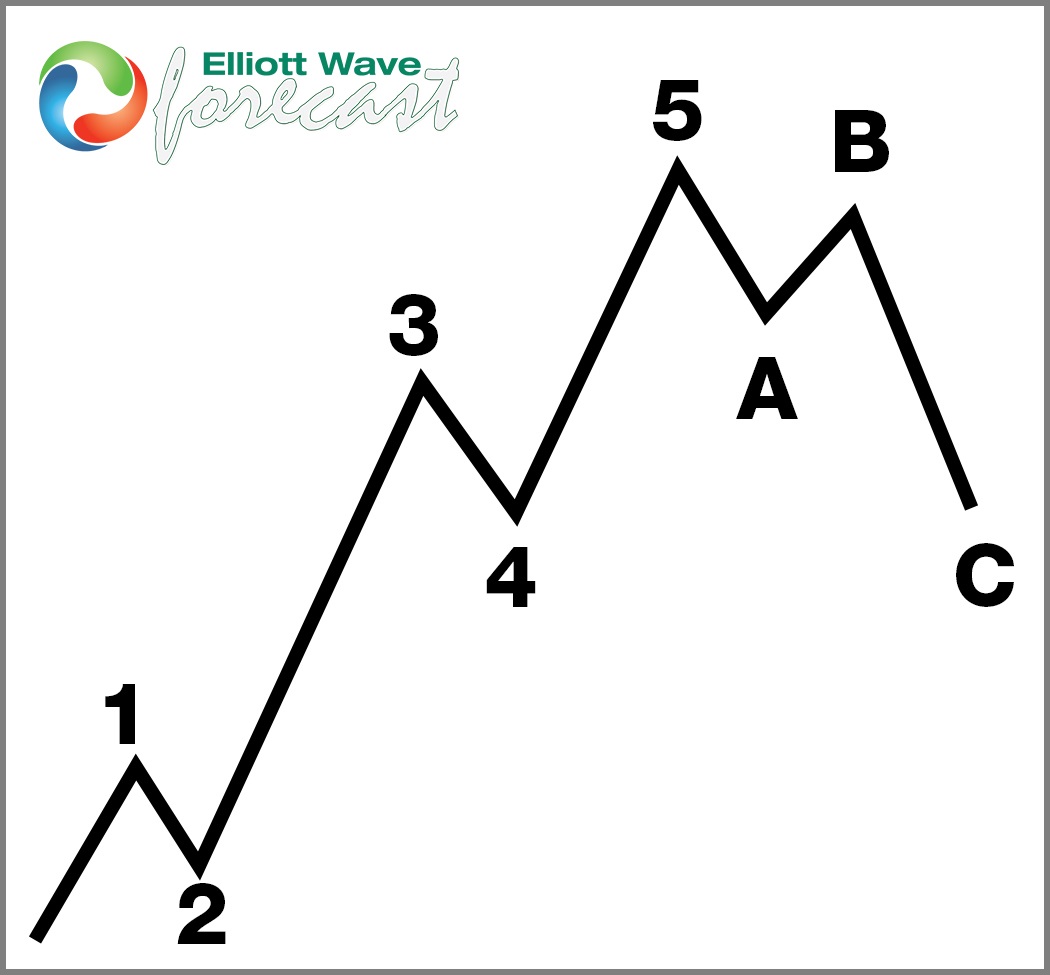
Graphic below shows a 5 waves advance from the low to the high, this is called an Elliott Wave Impulse. Wave 1, 3 and 5 should also be impulses, wave 2 and 4 should be corrective structures. Wave 3 must not be the shortest wave in the sequence, wave 4 shouldn’t enter the territory of wave 1 (unless structure is a diagonal) and there must be momentum divergence between wave 3 and 5. Following completion of an impulse wave, there is a move in the opposite direction in 3 waves at least. This move is shown as an ABC (Zigzag structure) in the graphic below.

Nasdaq Futures 1 Hour Elliott Wave Analysis – 2 June 2022
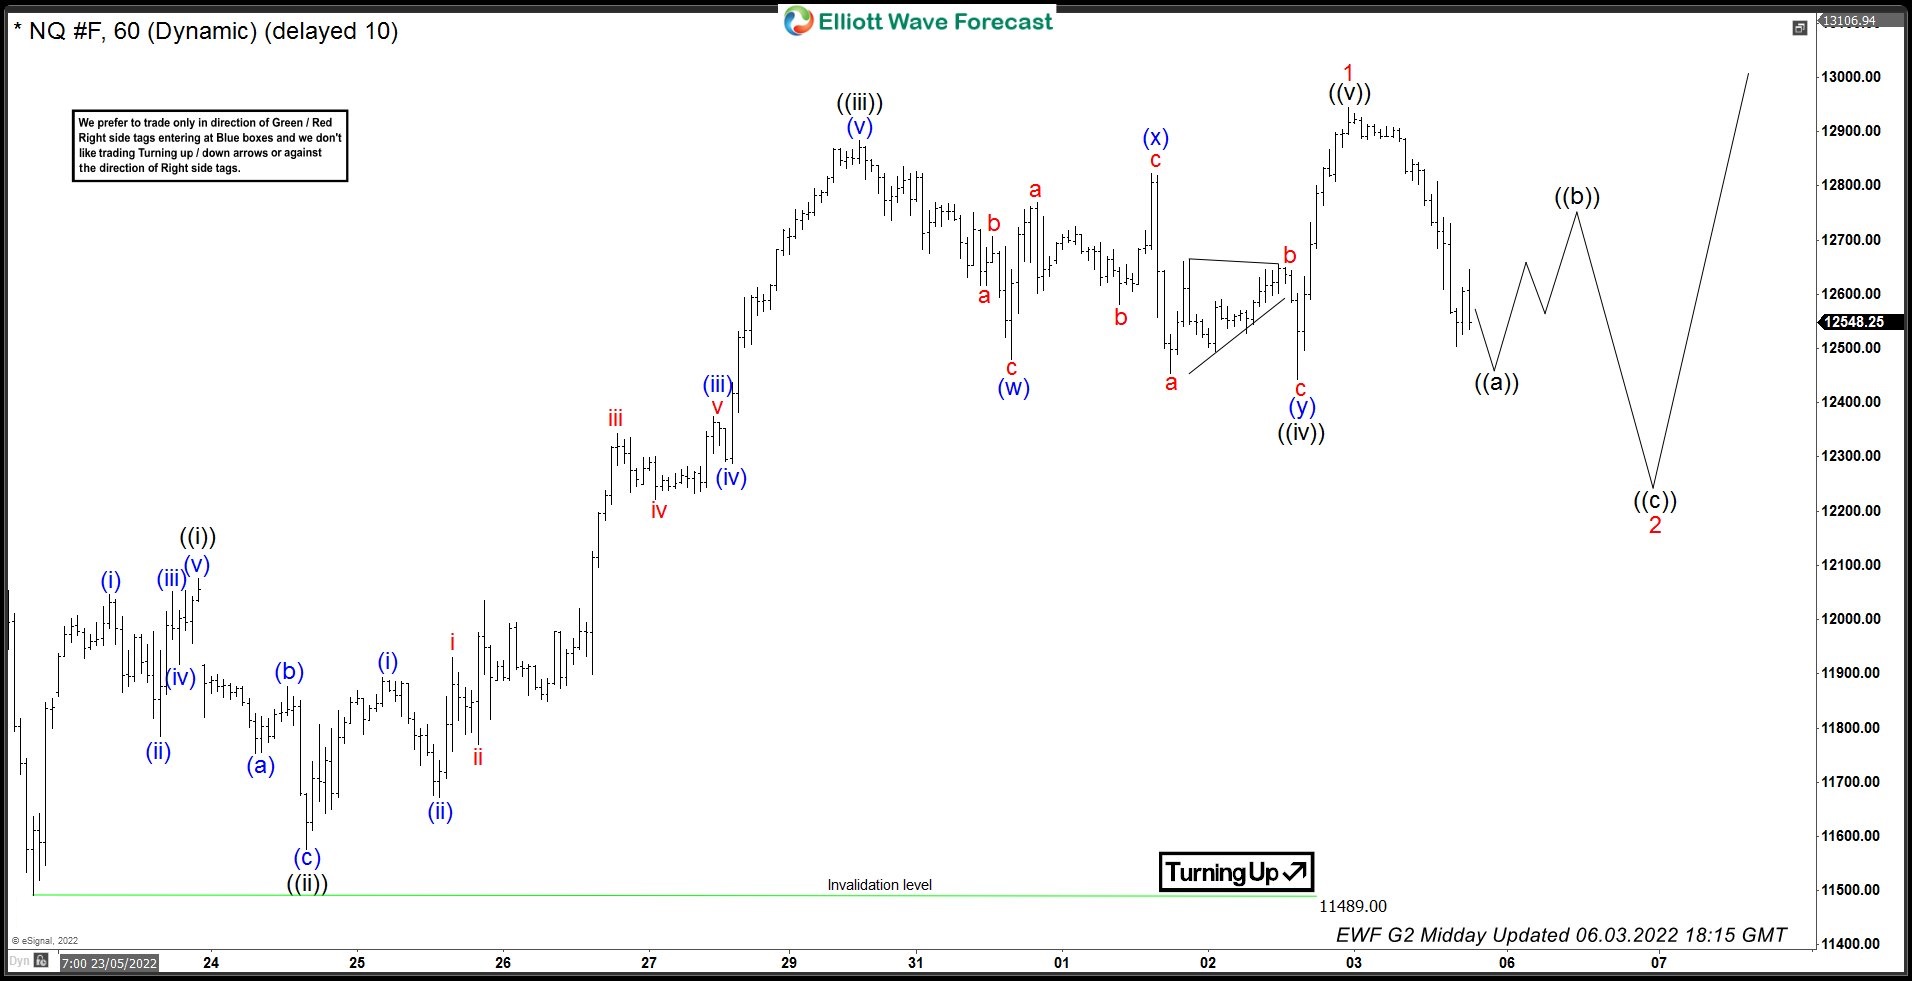
Chart below Nasdaq Futures found a low at 11492.81 on May 20, 2022. Up from there wave (( i )) ended at 12075.50, wave (( ii )) pull back ended at 11675.25, wave (( iii )) ended at 12883, wave (( iv )) ended at 12454.75 and now it is expected to trade higher in wave ((v)) to complete 5 waves up from May 20, 2022 low.
Nasdaq Futures 1 Hour Elliott Wave Analysis – 3 June 2022
Chart below shows Nasdaq Futures made a marginal new low below 12454.75 low but rally from May 20, 2022 low was in 3 waves so this new low was treated as part of wave ((iv)) which completed at 12442.50. Price went on to make a new high above wave ((iii)) as expected and completed wave ((v)) at 12945.25 and pulled back sharply. Following an Impulse Elliott wave structure, there should be a 3 waves move at minimum in the opposite direction so we are expecting a 3 waves pull back at least to correct the cycle from May 20, 2022 low before Nasdaq futures turn higher again. We are close to completing wave ((a)) and once completed, expect a bounce in wave ((b)) to fail below 12945.25 peak before ((c)) leg lower to complete wave 2 and then resume the rally in wave 3 or bounce in 3 waves at least. If price makes a new high above 12945.25, wave ((v)) could take the form of an extended wave ((v)).

Source: https://elliottwave-forecast.com/stock-market/nasdaq-path-elliott-wave/

