Good day Traders and Investors. In today’s article, we are going to take a look at the Elliott Wave path in Chewy Inc. ($CHWY)
Chewy, Inc. founded in 2010, is an American online retailer of pet food and treats, pet supplies and pet medications, and other pet-health products, as well as pet services. It offers approximately 100,000 products from 3,000 partner brands. In 2017, Chewy was acquired by PetSmart for $3.35 billion, which was the largest ever acquisition of an e-commerce business at the time.
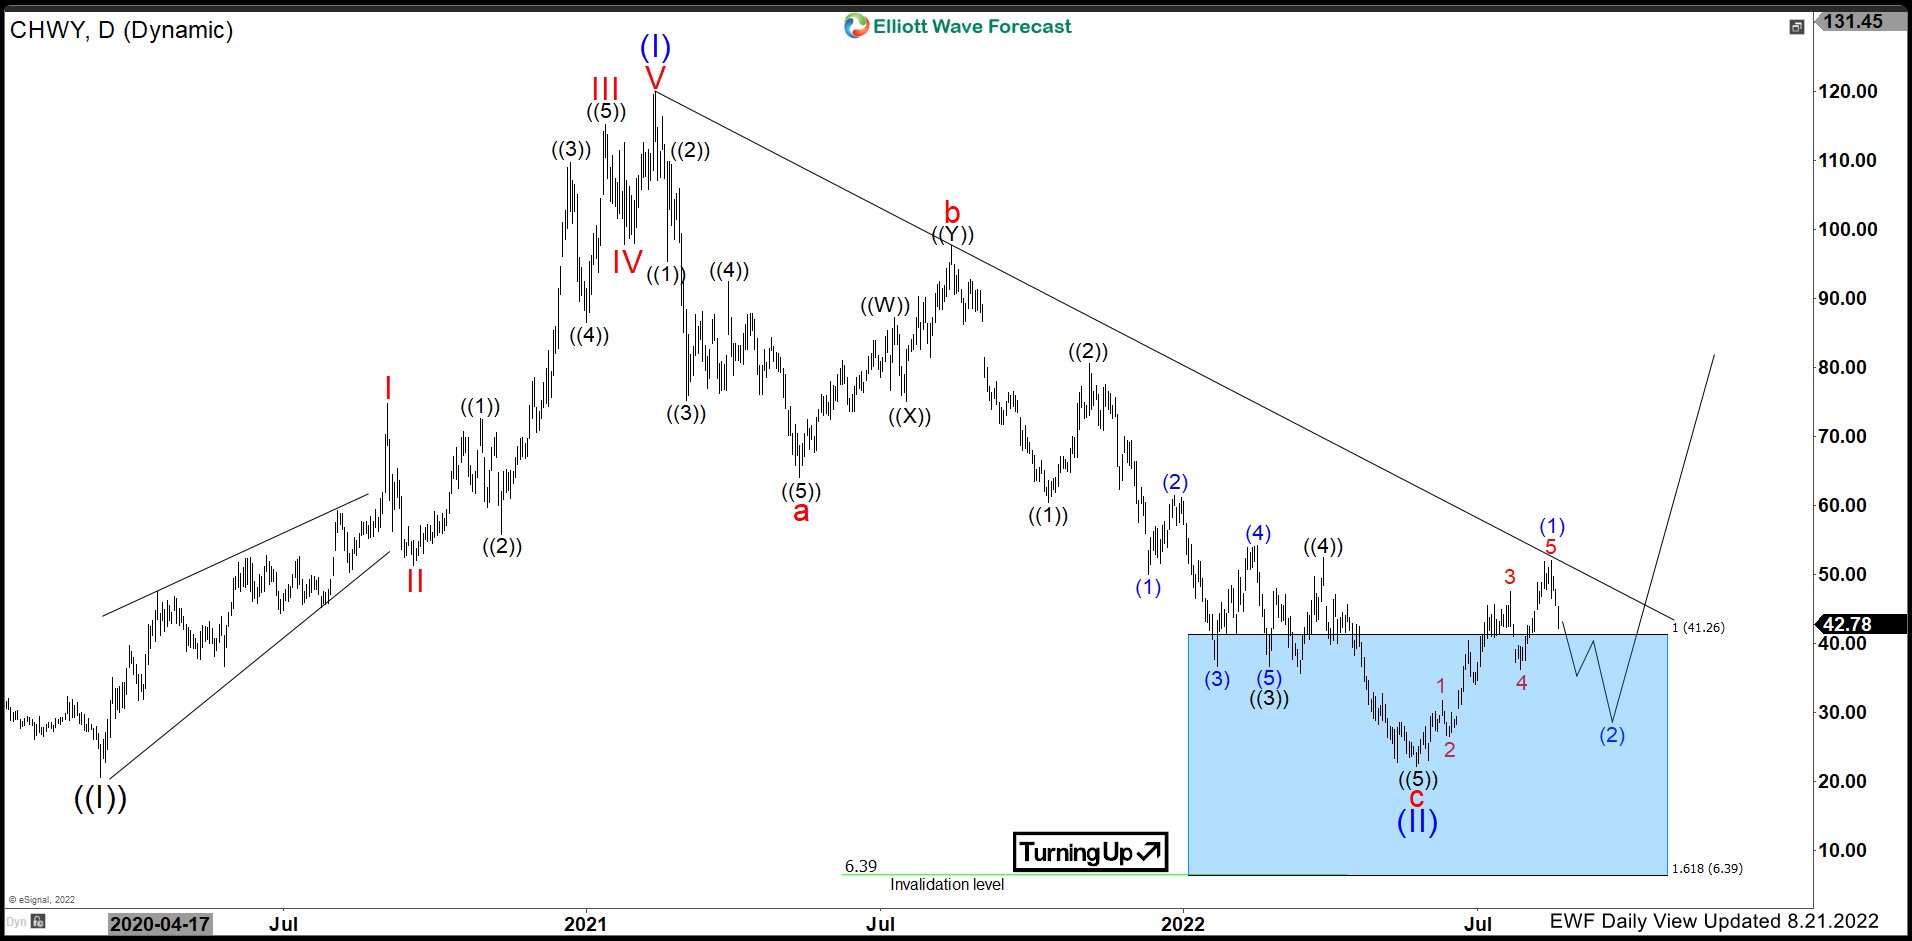
CHEWY Elliottwave Latest View (Daily):

The Daily Chart above shows the rally from March 2020 unfold in a 5 swing impulse. The stock ended the cycle from 03/2020 on 02/2021 at $120 and started to decline. Since the peak at $120, the stock has unfolded in a corrective zigzag structure (abc). We have the first 5 swings in red a followed by a bounce in b that peaked on 08/09/2021 at $97.74. Red c went on and also unfolded in a 5 swing structure with an expanded flat in the wave ((4)) connector to reach $22.22 on 05/24/2022 at ((5) of c of (II). It also reached the Daily Blue box area from the all time peak which comes at $41.26 – 6.39. The bounce from 05/24/2022 at $22.22 appears to be impulsive taking the 08/09/2021 pivot at red b and breaking above the Weekly RSI channel from the all-time peak. As long as price remains above 05/24/2022 low at $22.22, the low can be in place and the stock is favoured to keep extending higher.
Source: https://elliottwave-forecast.com/stock-market/chewy-inc-chwy-bottomed-ready-rally/

