The Swiss Market Index (SMI) is Switzerland’s blue-chip stock market index, which makes it the most followed in the country. It is made up of 20 of the largest and most liquid Swiss Performance Index (SPI) stocks. The SMI is not adjusted for dividends.
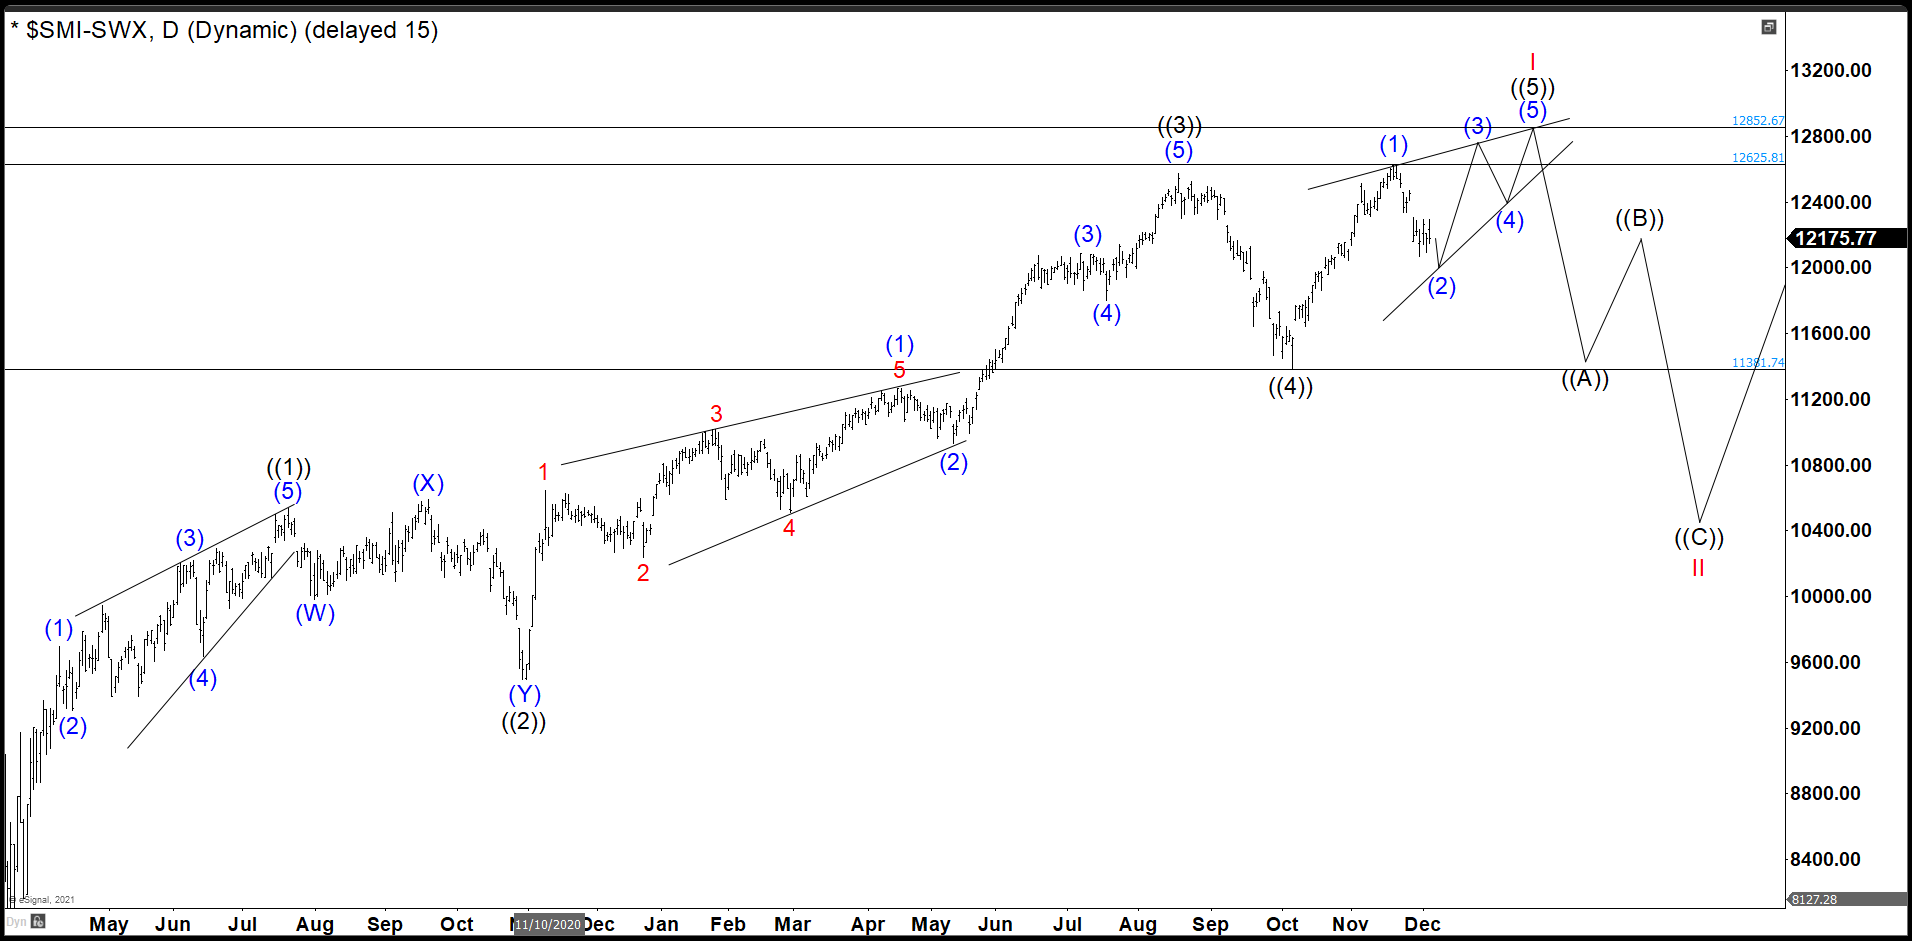
SMI December 04th Daily Chart

This is last year’s chart, where we looked to end an impulse from the March 2020 low with an ending diagonal structure. From there we expected a retracement to correct the entire cycle.
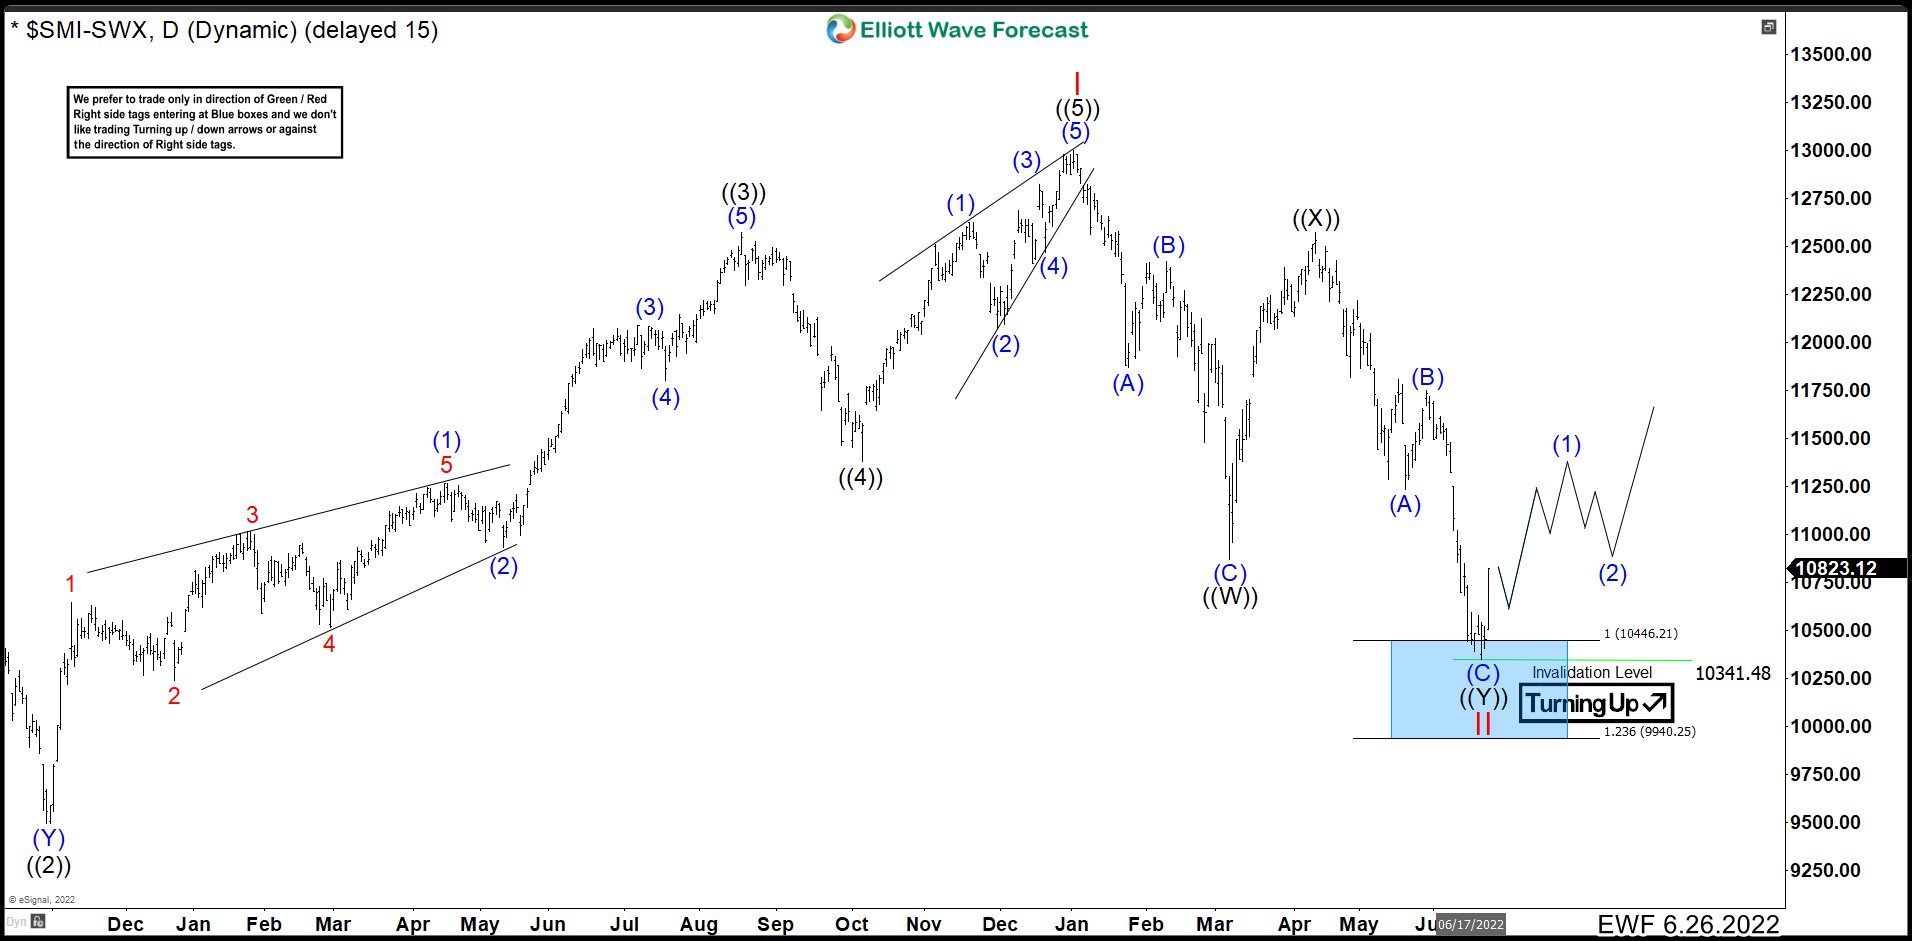
SMI June 26th Daily Chart

In this June 2022 chart, we can see SMI index ended wave I at 12997 and wave ((5)) as an ending diagonal structure. From here, market did a double correction structure to the blue box and we expected to continue the rally or see 3 swings higher at least. (If you want to learn more about double correction or Elliott Wave Theory, follow these links: Elliott Wave Education and Elliott Wave Theory).
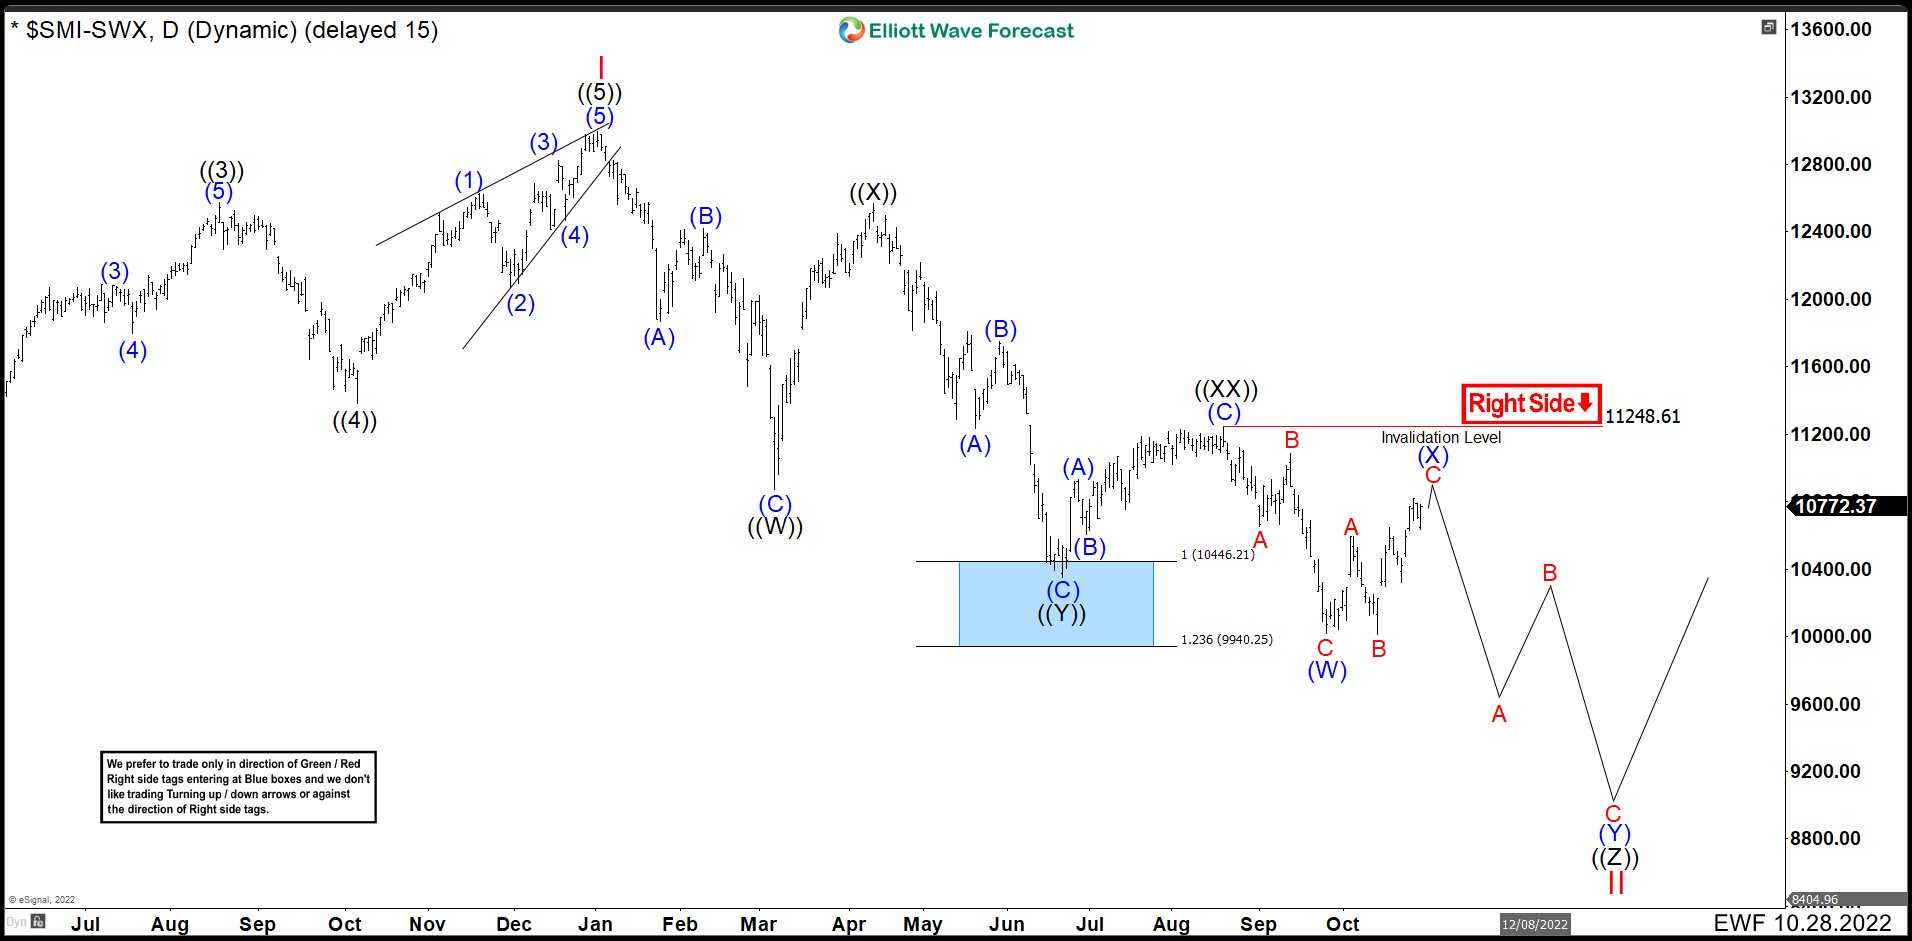
SMI October 28th Daily Chart

The bounce could never have bullish momentum and after a short rally the market broke below 10340.75 creating a bearish sequence. We adjusted the count as a triple correction because rally was a bit short. SMI completed wave ((XX)) at 11248.61 and resumed down in 3 swings to end wave (W) at 10016.06. Currently, it is building the connector (X) as a flat correction. For this, we need at least one more high above 10821.77 to complete an impulse C before continue the move down in wave ((Z)).
The count is valid as long as it is below 11248.61. A break of this level the SMI would enter a much more complex correction. To complete the triple correction, we must break the low of 10016.06 in 3 swings at least. Once this is done, the market can continue to rally at any time or continue to run lower with 3 more swings.
Source: https://elliottwave-forecast.com/stock-market/smi-swiss-index-entered-triple-correction/

