
Good day Traders and Investors. In today’s article, we will look at the past performance of 4 Hour Elliottwave chart of Nike Inc. ($NKE). The decline from 08.16.2022 high unfolded as 5 swings which created a bearish sequence in the 4H timeframe. Therefore, we knew that the structure in $NKE is incomplete to the downside & should see more weakness in 3 or 7 swings against 08.16.2022 peak. So, we advised members to sell the bounces in 3, 7, or 11 swings at the blue box area. We will explain the structure & forecast below:
$NKE 4H Elliottwave Chart 10.31.2022:
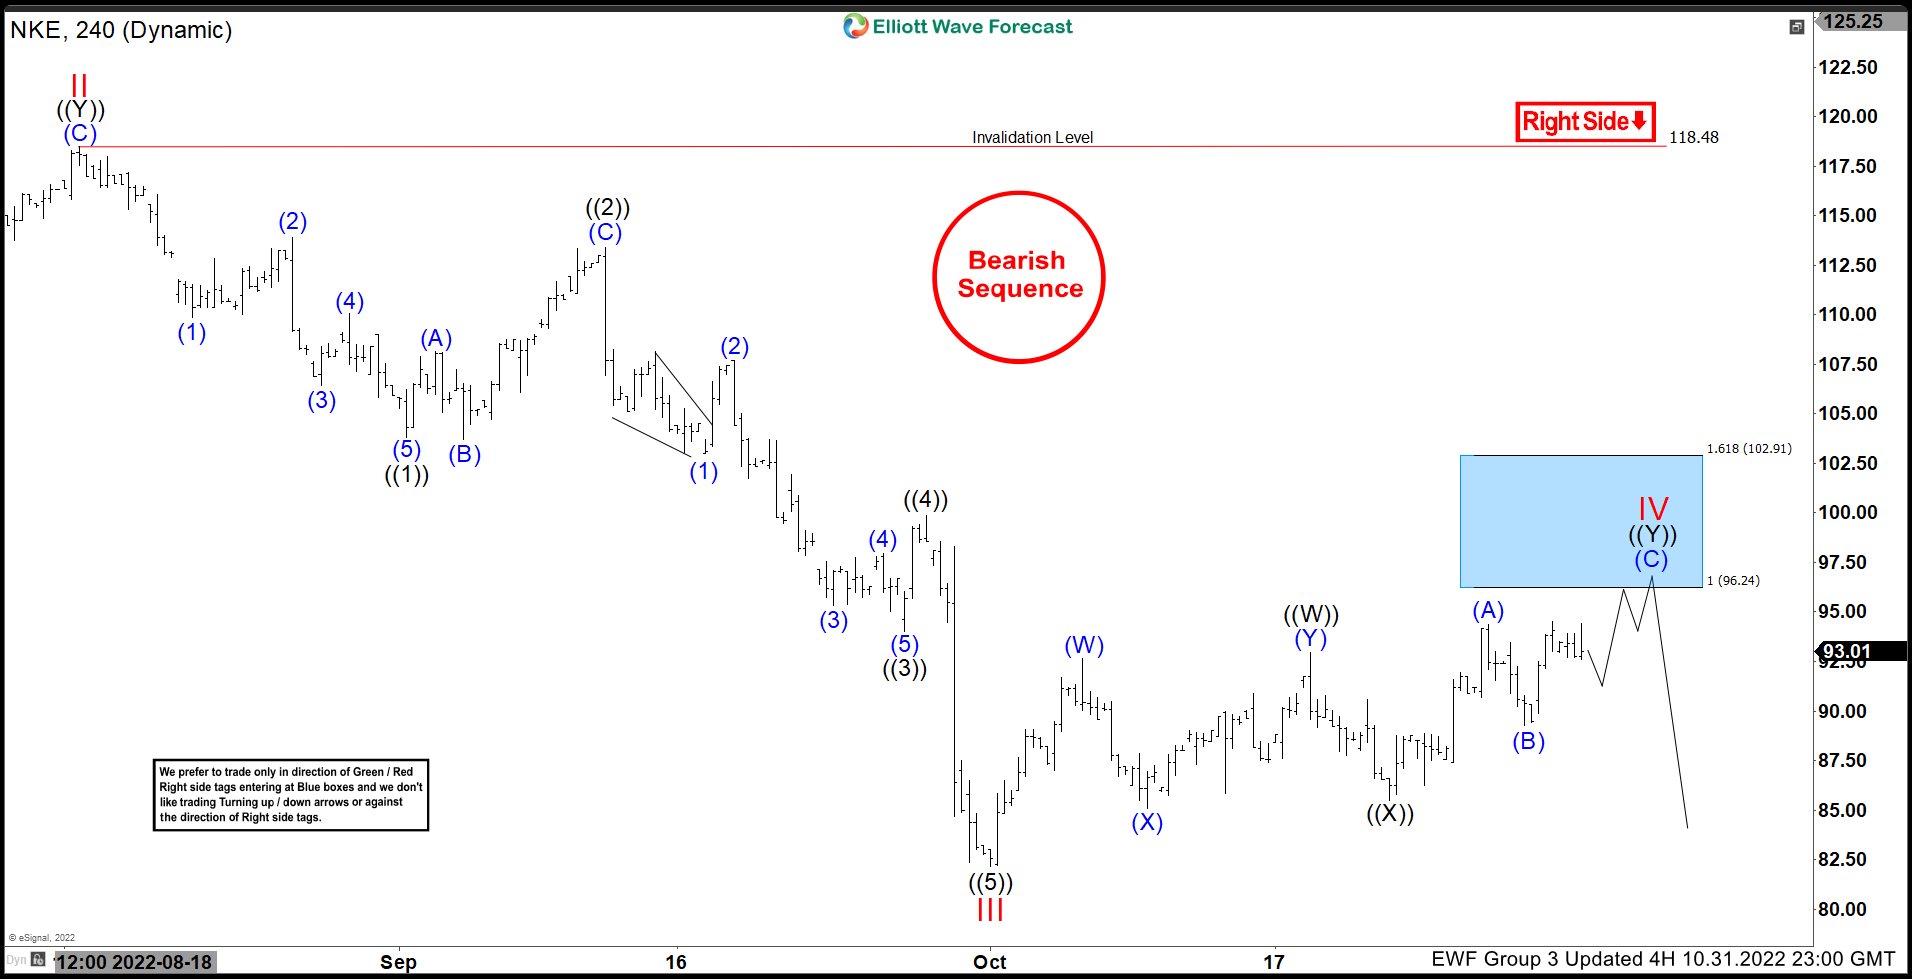
Here is the 4H Elliottwave count from 10.31.2022. The decline from 08.16.2022 unfolded in 5 waves breaking below 07.01.2022 low creating a bearish sequence. We were calling for the bounce to fail in 7 swings at black ((Y)) of IV where we like to sell it at the equal legs at $96.24 with a stop at $102.91.
$NKE Latest Elliottwave Chart:
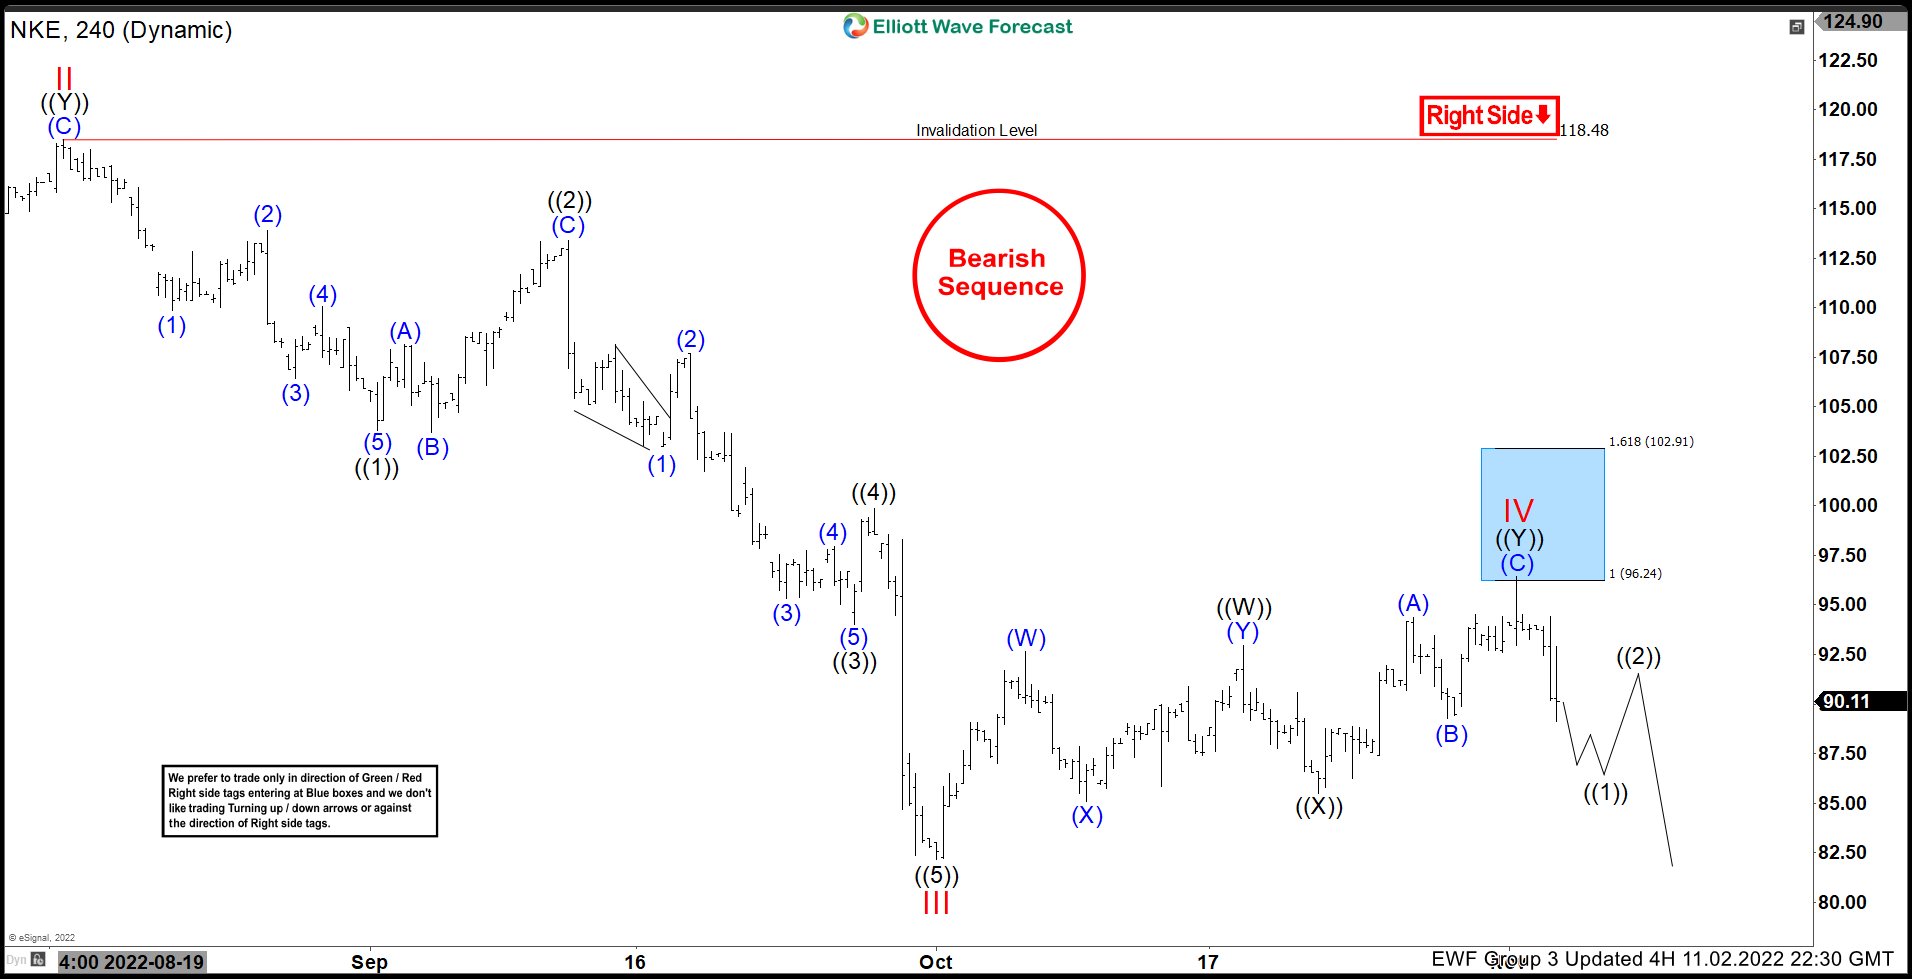
Here is the 11.02.2022 4H update showing the move taking place as expected. The stock has reacted lower from the blue box to reach the 50% back from black ((X)) allowing any shorts to get risk free shortly after taking the position.
Source: https://elliottwave-forecast.com/stock-market/nike-inc-nke-perfect-reaction-lower-blue-box-area/