
In this technical blog, we will look at the past performance of the 4-hour Elliott Wave Charts of XLK. The decline from the 16 August 2022 high unfolded as an impulse sequence and showed a lower low sequence within the bigger cycle from December 2021 peak. Therefore, we knew that the structure in XLK is incomplete to the downside & should see more weakness. So, we advised members to sell the bounces in 3, 7, or 11 swings at the blue box areas. We will explain the structure & forecast below:
XLK 4-Hour Elliott Wave Chart

Here’s 4 hour Elliott wave Chart from the 11/13/2022 Weekend update. In, the decline to the $112.97 low ended 5 waves from the 8/16/2022 high in wave ((1)) & made a bounce in wave ((2)). The internals of that bounce unfolded as an Elliott wave zigzag correction where wave (A) ended at a $130 high. Then a pullback to $117.98 low ended wave (B) pullback and started the (C) leg higher towards $135.12- $145.72 blue box area from where sellers were expected to appear looking for more downside or for a 3 wave reaction lower at least.
XLK Latest 4-Hour Elliott Wave Chart
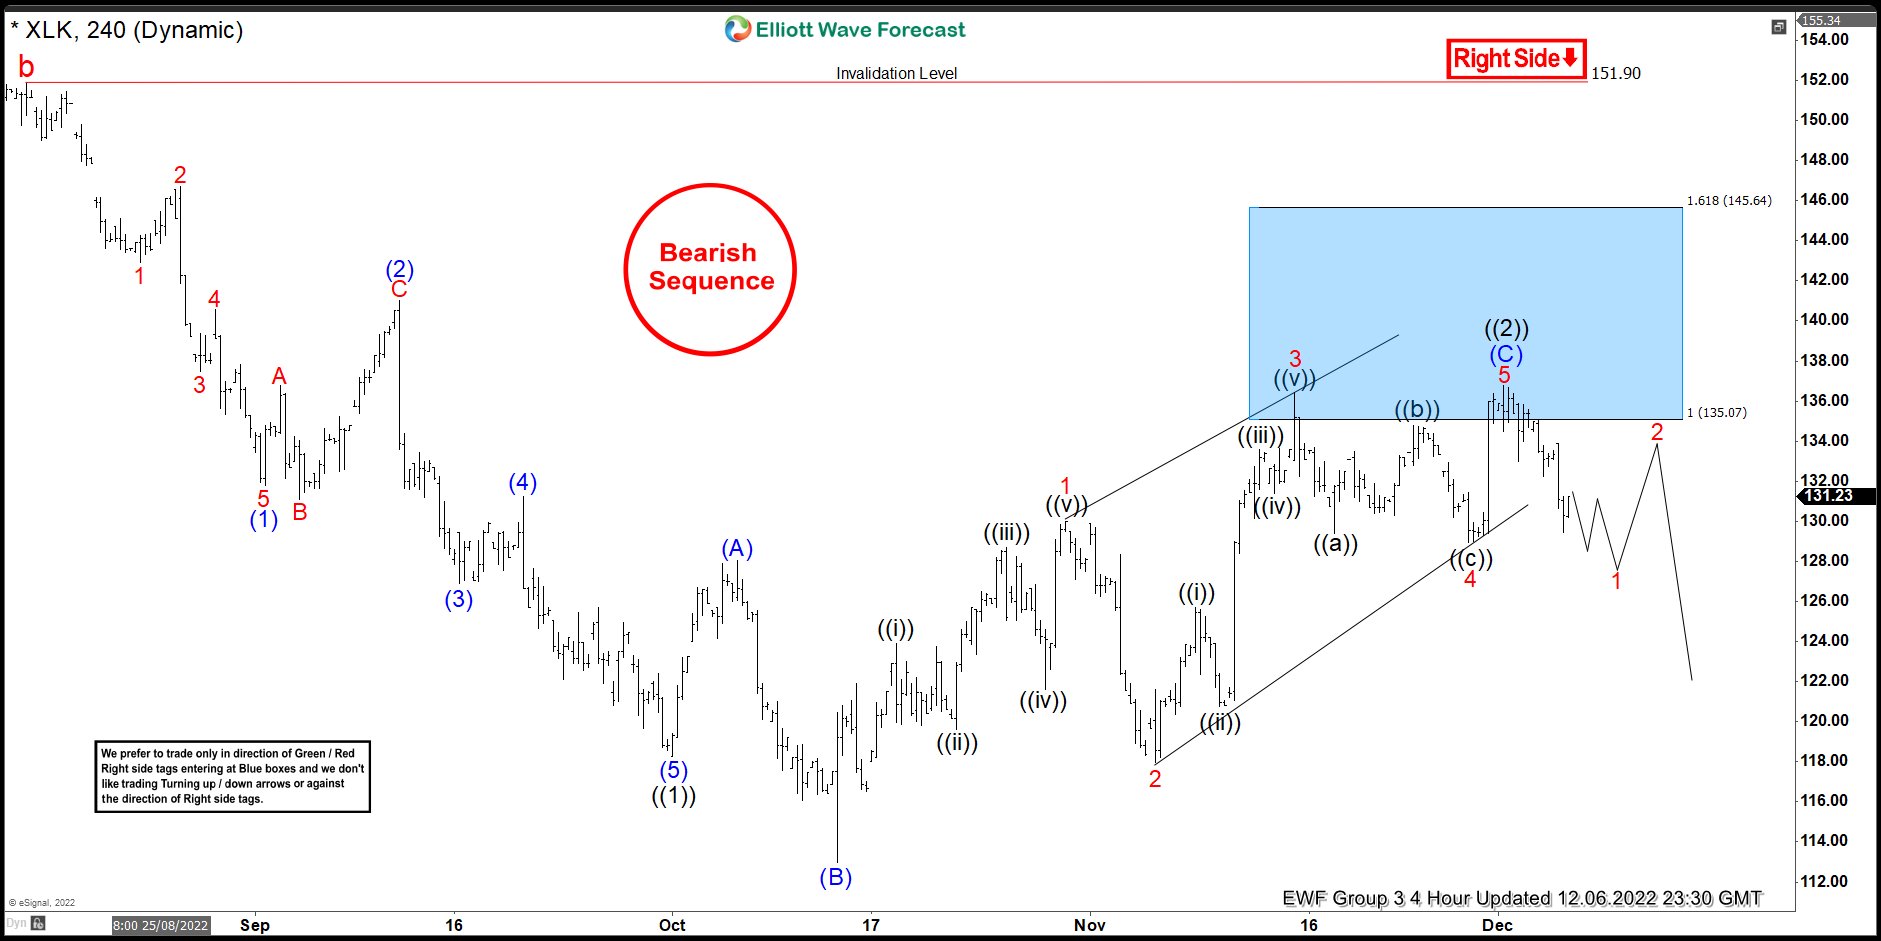
This is the Latest 4-hour view from the 12/06/2022 update. In which the ETF is showing a reaction lower taking place from the blue box area. However, with further data, we believe the correction unfolded as a flat correction & sellers must be looking for $127.35- $125.11 area to get into a risk-free position.
Source: https://elliottwave-forecast.com/stock-market/xlk-perfectly-reacting-lower-blue-box/