Platinum (PL) continues to trade sideways and the metal is in the process of forming an important low before the next major bullish cycle starts. The Federal Reserve has aggressively hiked rates multiple times, creating a sideways to lower movement in the commodity sectors. There’s however no doubt that the longer term outlook of commodities is bullish. At this stage, there’s enough number of swing to call the daily and monthly correction completed. However, we still need more data and evidence to call the correction completed. In the meantime, we still give a possibility for the metal to extend lower until the market says otherwise. Below is the update of the Elliott Wave chart in Platinum.
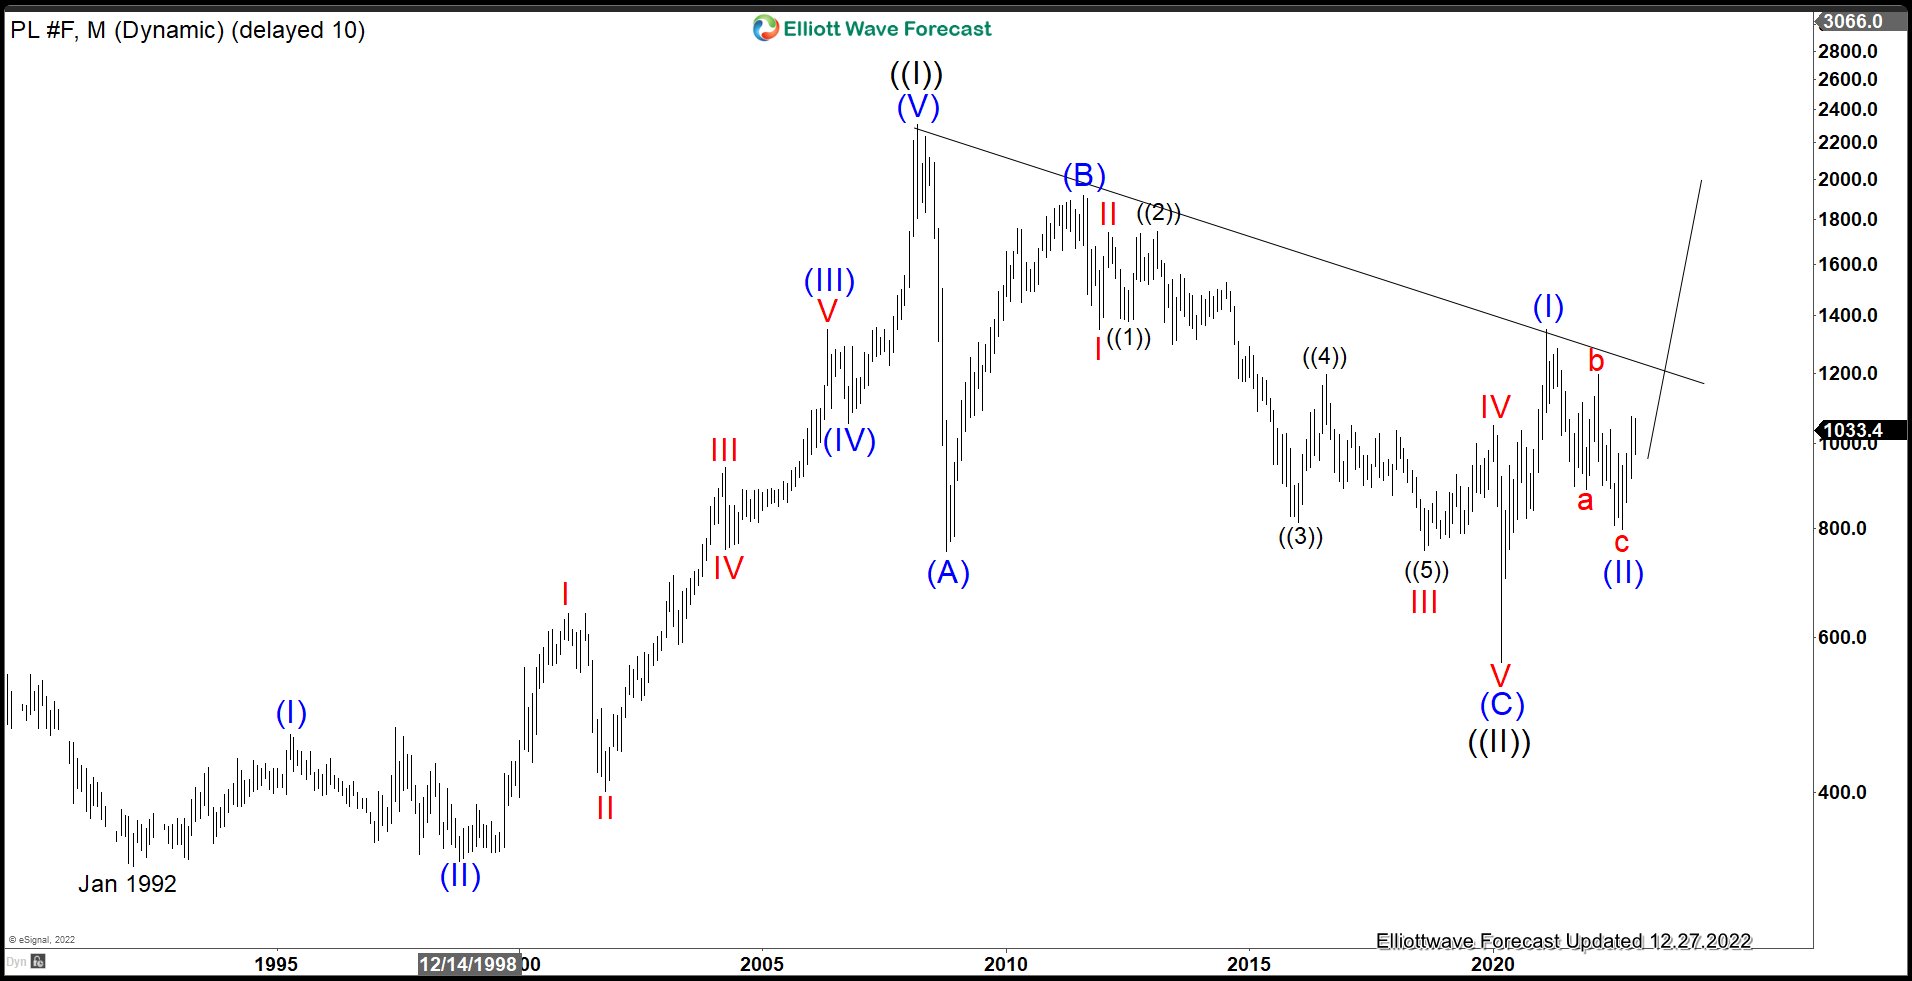
Platinum Monthly Elliott Wave Chart

Monthly Elliott Wave Chart of Platinum (PL) above suggests that the metal spent majority of the time in 2022 to correct the rally from March 2020 low. The entire rally from 1992 low ended with wave ((I)) at 2308.8 and pullback in wave ((II)) ended at 562. The metal extends higher in wave ((III)) with internal subdivision as another impulse. Up from wave ((II)), wave (I) ended at 1348.2 and pullback in wave (II) is proposed complete at 796.8. Expect Platinum to extend higher in 2023 as it resumes the next bullish cycle.
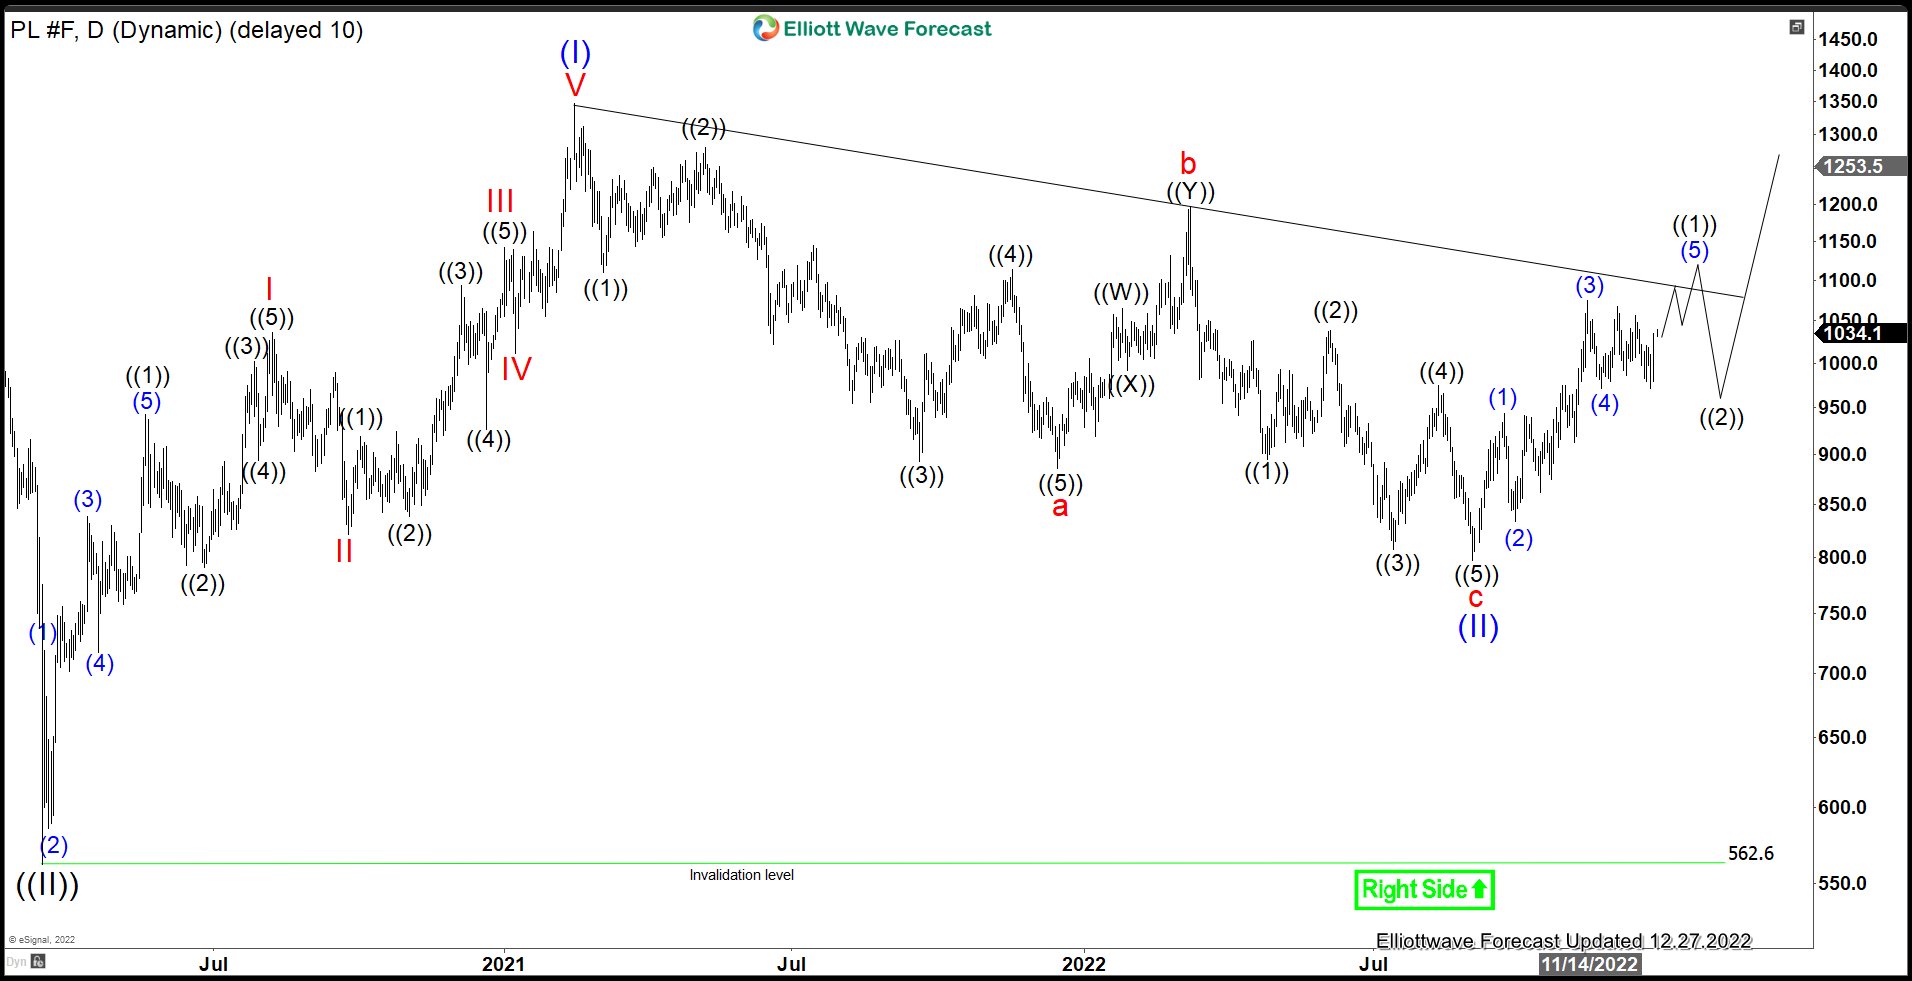
Platinum Daily Elliott Wave Chart

Daily Elliott Wave Chart for Platinum suggests that wave (II) pullback already completed at 796.8. This view will get confirmation when the metal manages to break above previous peak wave (I) at 1348.2. Successful break, if it happens, will also rule out a double correction in the metal. The current stage as we get close to end 2022 sets up for a promising bullish outlook in 2023. We continue to expect further upside as far as it stays above 562.6.
Source: https://elliottwave-forecast.com/commodities/platinum-pl-ready-rally-2023/
